
# Operation Center - Statistical Analysis
# 1. Feature Overview
The data statistics feature is a crucial component of the Operation Center, providing users with a powerful tool for data collection, processing, and analysis. This feature is designed to help users gain deep insights into Mini-Program operation status, user behavior, and business performance through quantitative methods. With detailed data tracking and analysis, users can more effectively monitor business progress, make data-driven decisions, and optimize Mini-Program performance and user experience.
# 2. Terminology Definitions
The statistical analysis feature includes the following content modules, offering users detailed and user-friendly analytical capabilities.
| Name | Explanation |
|---|---|
| Data Dashboard | The Data Dashboard module provides users with an interface that centrally displays Key Performance Indicators (KPIs). Through intuitive charts, digital dashboards, and key metric cards, users can grasp real-time data and historical trends of Mini-Programs at a glance. The Data Dashboard supports custom configuration, allowing users to select the data types and time ranges for display based on their needs, thereby quickly accessing the most important business information. |
| Page Data | The Page Data statistics module focuses on analyzing user behavior and performance on various pages of the Mini-Program. By tracking key metrics such as page views, user dwell time, and bounce rate, users can gain deep insights into which pages are most popular, how users interact on each page, and the reasons users leave pages. This data is significant for optimizing page design, enhancing user experience, and improving conversion rates. |
| Performance Data | The Performance Data statistics module monitors Mini-Program loading times, response speeds, and other key performance indicators. By analyzing this data, users can identify performance bottlenecks, optimize code and resource allocation, thereby improving Mini-Program responsiveness and stability. The Performance Data module provides users with real-time performance monitoring and alerting functions, ensuring the Mini-Program delivers a good user experience under various network and device conditions. |
| Data Reporting Management | Data Reporting Management is responsible for managing and monitoring the data reporting configuration of Mini-Programs. Users can configure the on/off status and frequency of data reporting through this module to ensure data accuracy and completeness. |
# 3. Usage Instructions
# 3.1 Data Dashboard
The Data Dashboard module provides users with an interface that centrally displays Key Performance Indicators (KPIs). The page shows aggregated core data for all Mini-Programs or data filtered by Mini-Program and time.
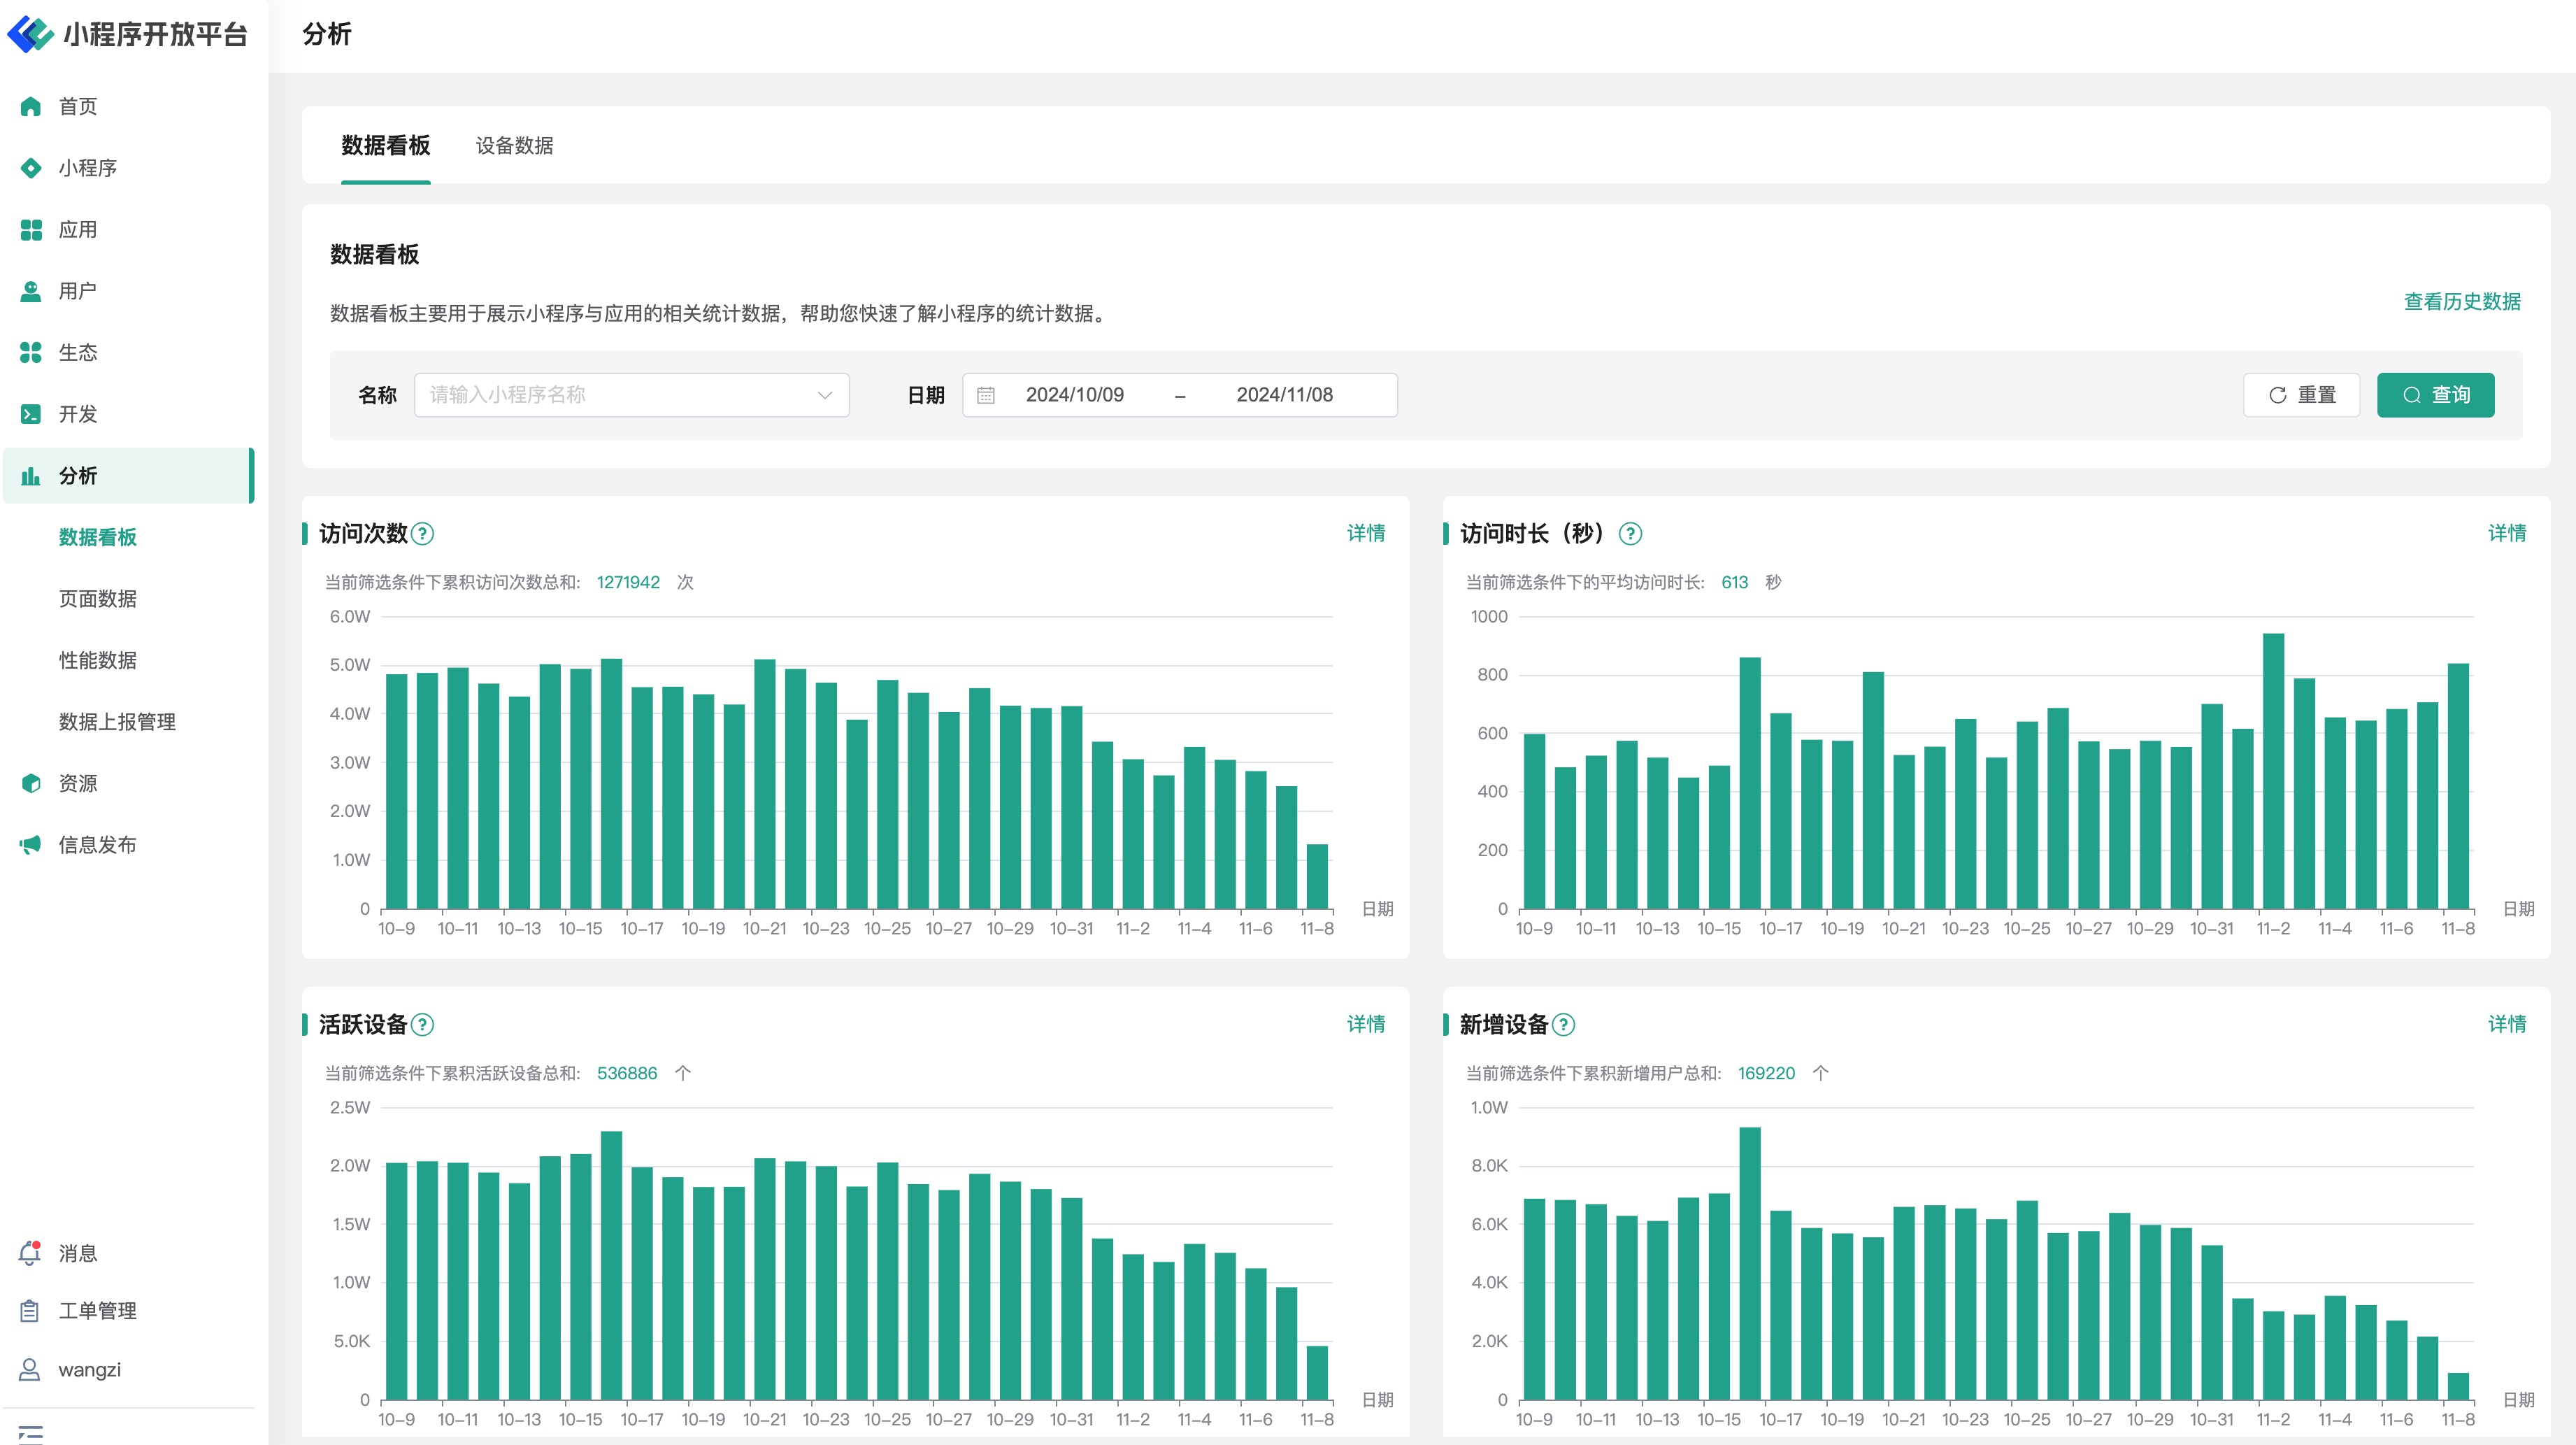
Core data includes:
- Visits: The total number of visits to the Mini-Program over a specified period.
- Average Visit Duration (seconds): The average duration of each user visit to the Mini-Program.
- Active Devices: The number of active users over a specified period.
- New Devices: The number of new users over a specified period.
- User Source (App): Data on the source of visits (traffic from different apps).
- User Source (Region): Geographic source data (province, city, etc.).
On the Data Dashboard page, users can also click the tabs at the top to view device data information based on different Mini-Programs.
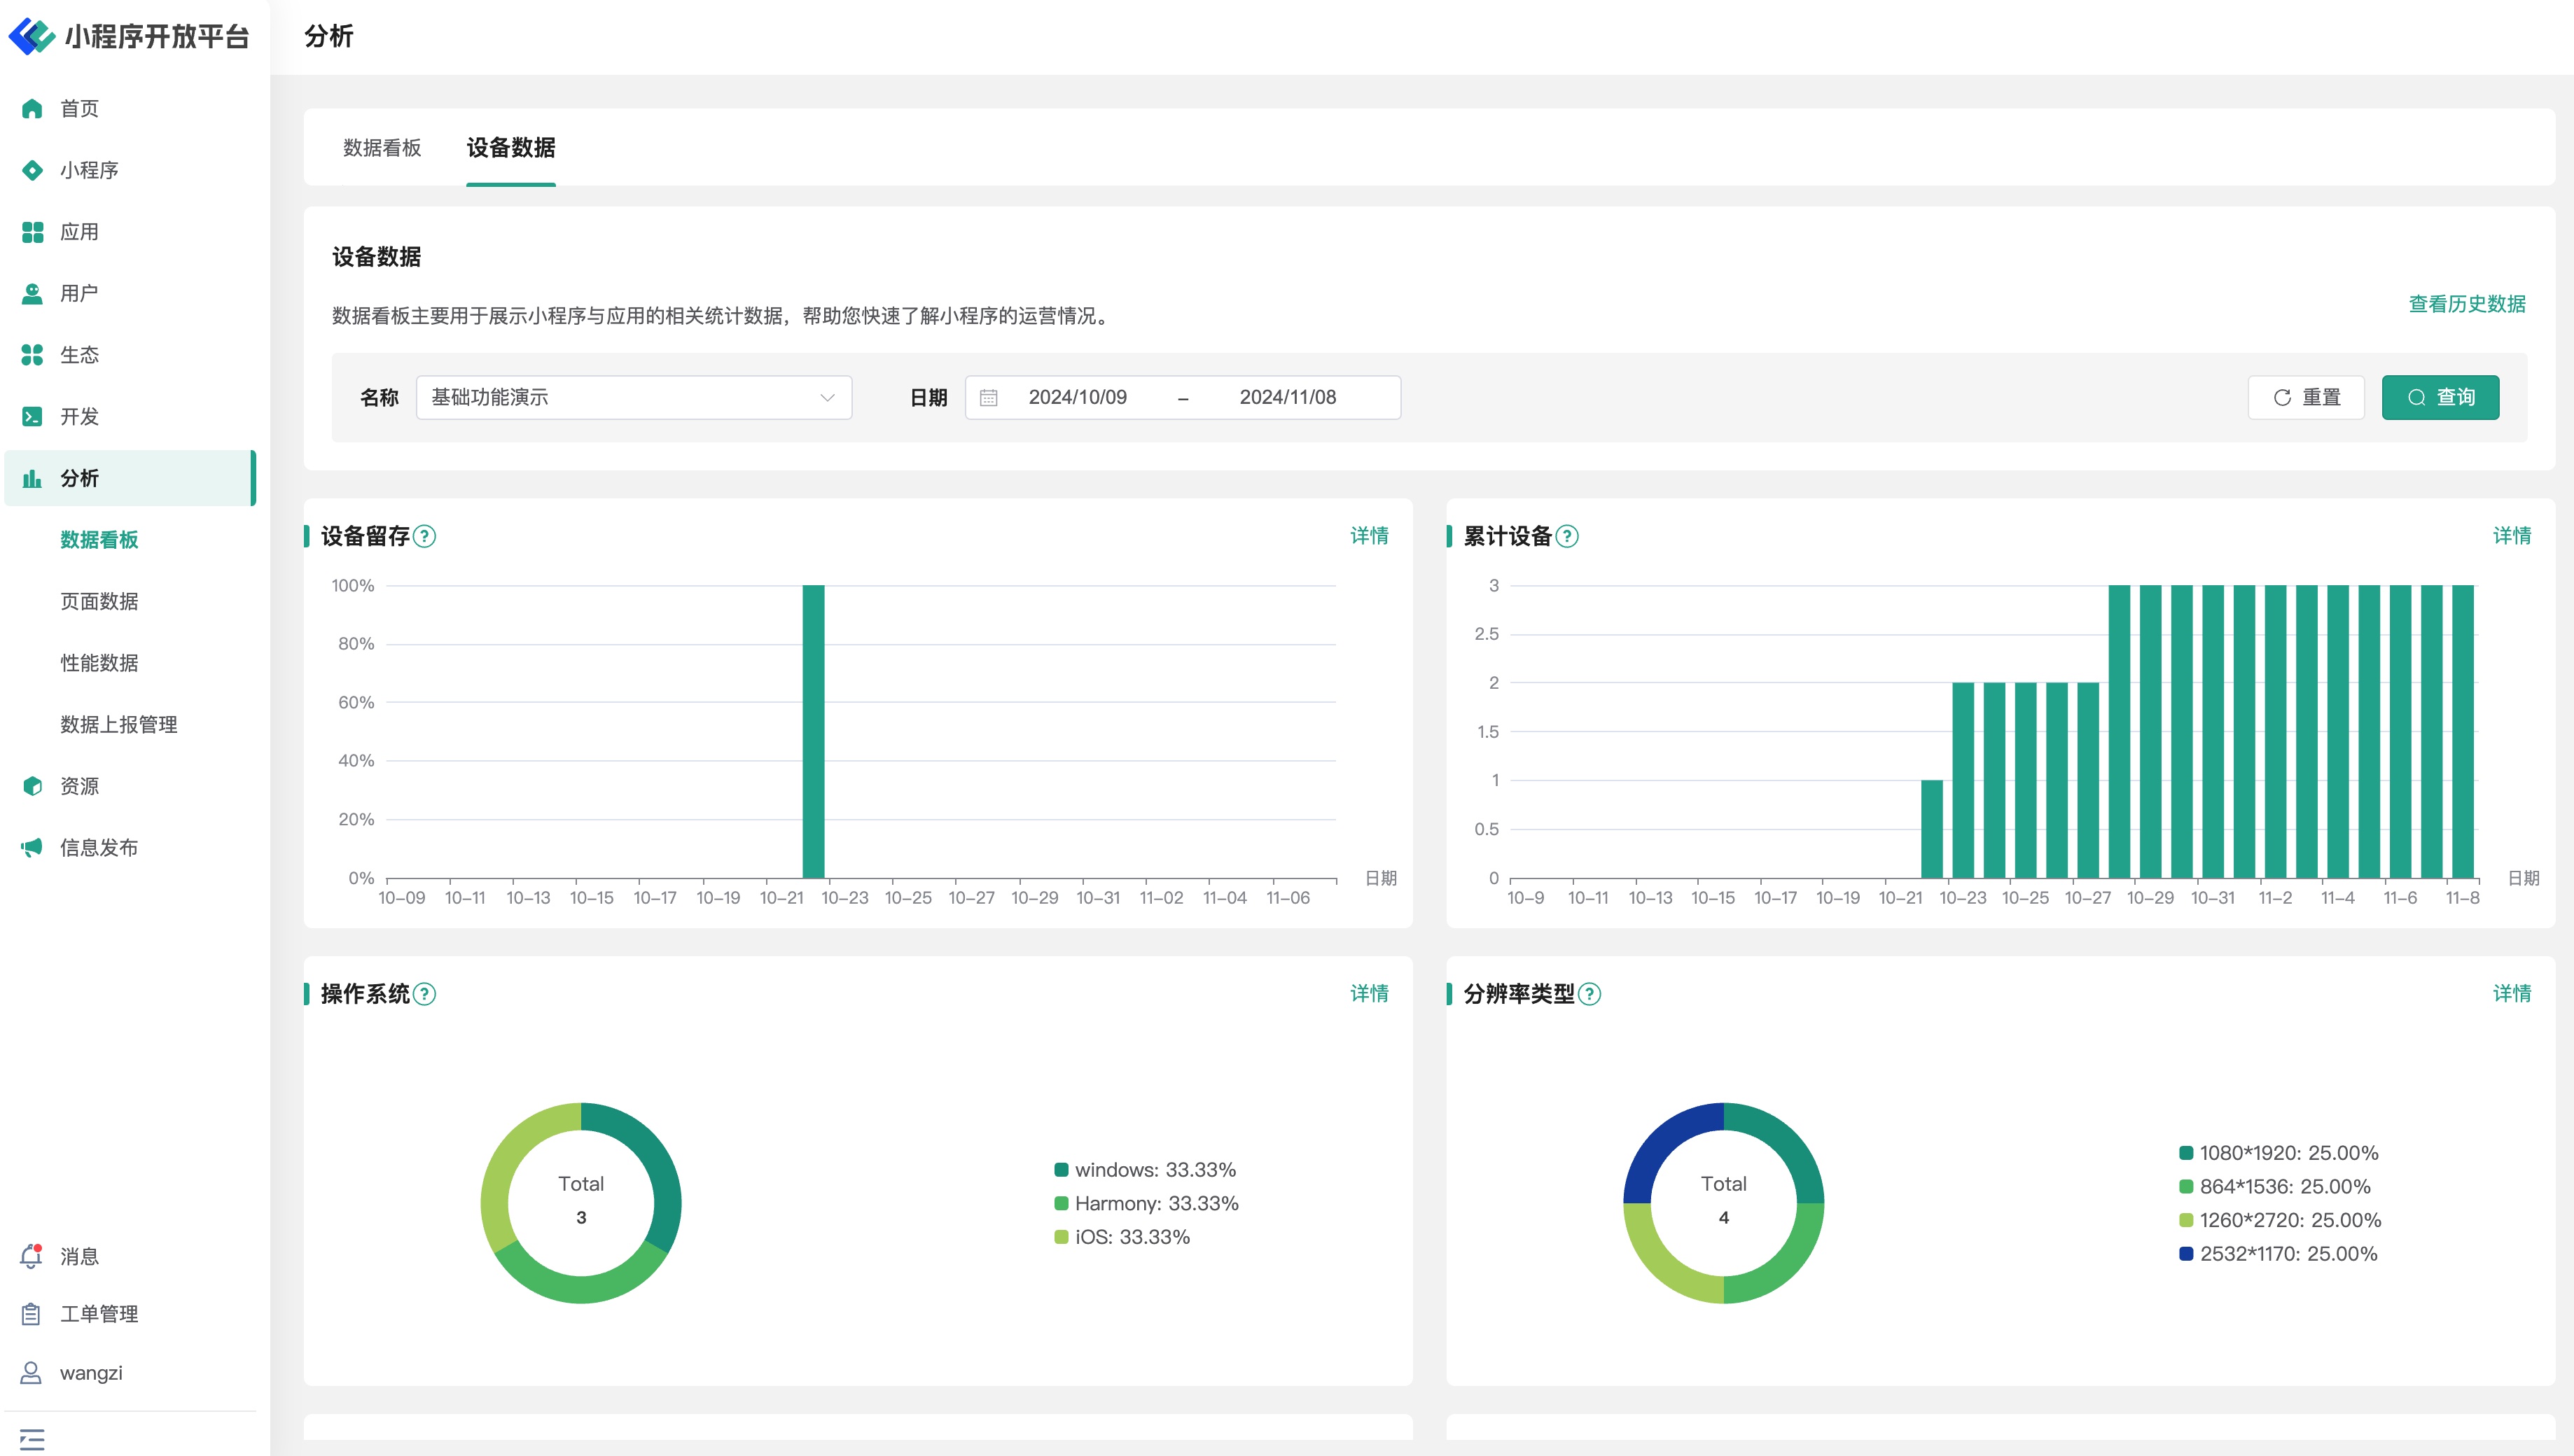
Device data includes:
- Device Retention: The device retention rate over a specified period, which can be statistically analyzed for different timeframes (e.g., 1-day retention, 7-day retention, 30-day retention).
- Cumulative Devices: The total cumulative number of devices over a specified period.
- Operating System: The operating system (iOS, Android, etc.).
- Resolution Type: Screen resolution (phone, tablet, etc.).
- Device Model: The model of mobile devices running the Mini-Program.
- Mini-Program SDK Version: Statistical information on the Mini-Program SDK versions.
- Mini-Program Base Library Version: Statistical information on the Base Library versions of the Mini-Program SDK.
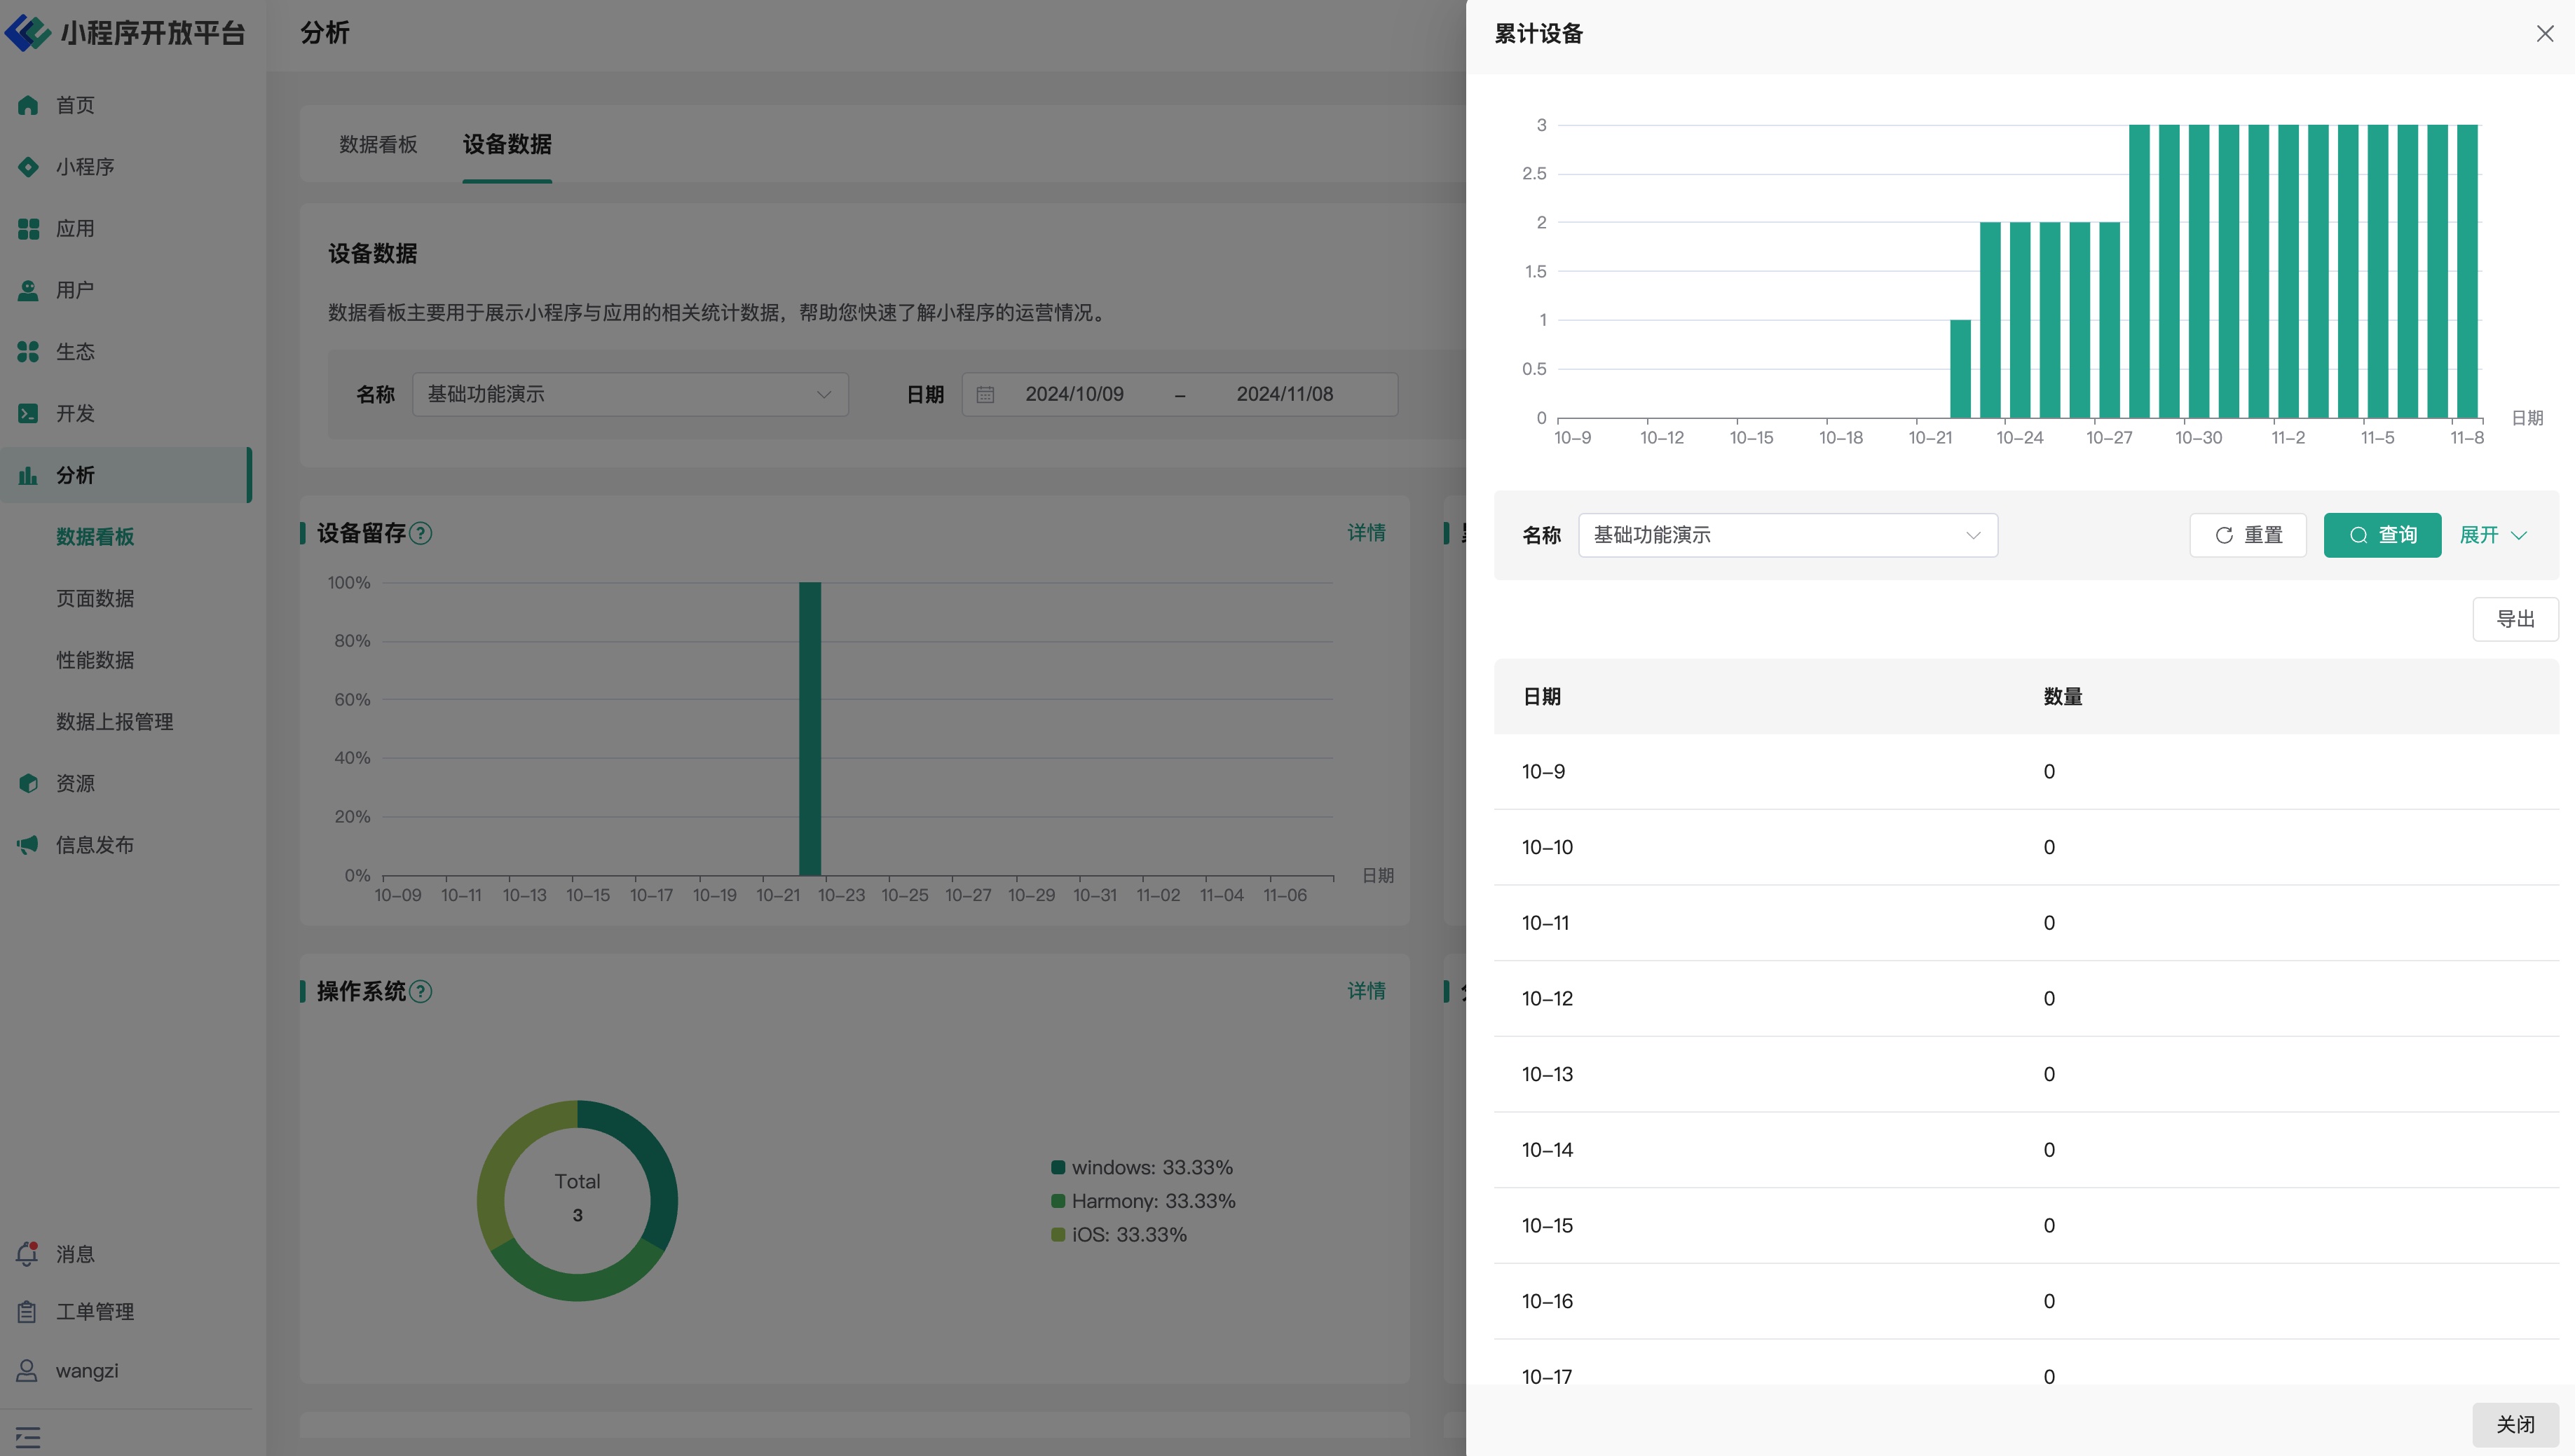 Clicking the card details in the upper right corner of the statistical analysis data reveals detailed information distributed by date.
# 3.2 Page Data
Page Data is the most fundamental concept in daily Mini-Program analysis. The relevant statistical indicators in Page Data are all based on the "page path" level (Path level). To analyze page access data at the "parameter" level (Query level), users can report the relevant data and then use the event statistics feature for corresponding statistical processing.
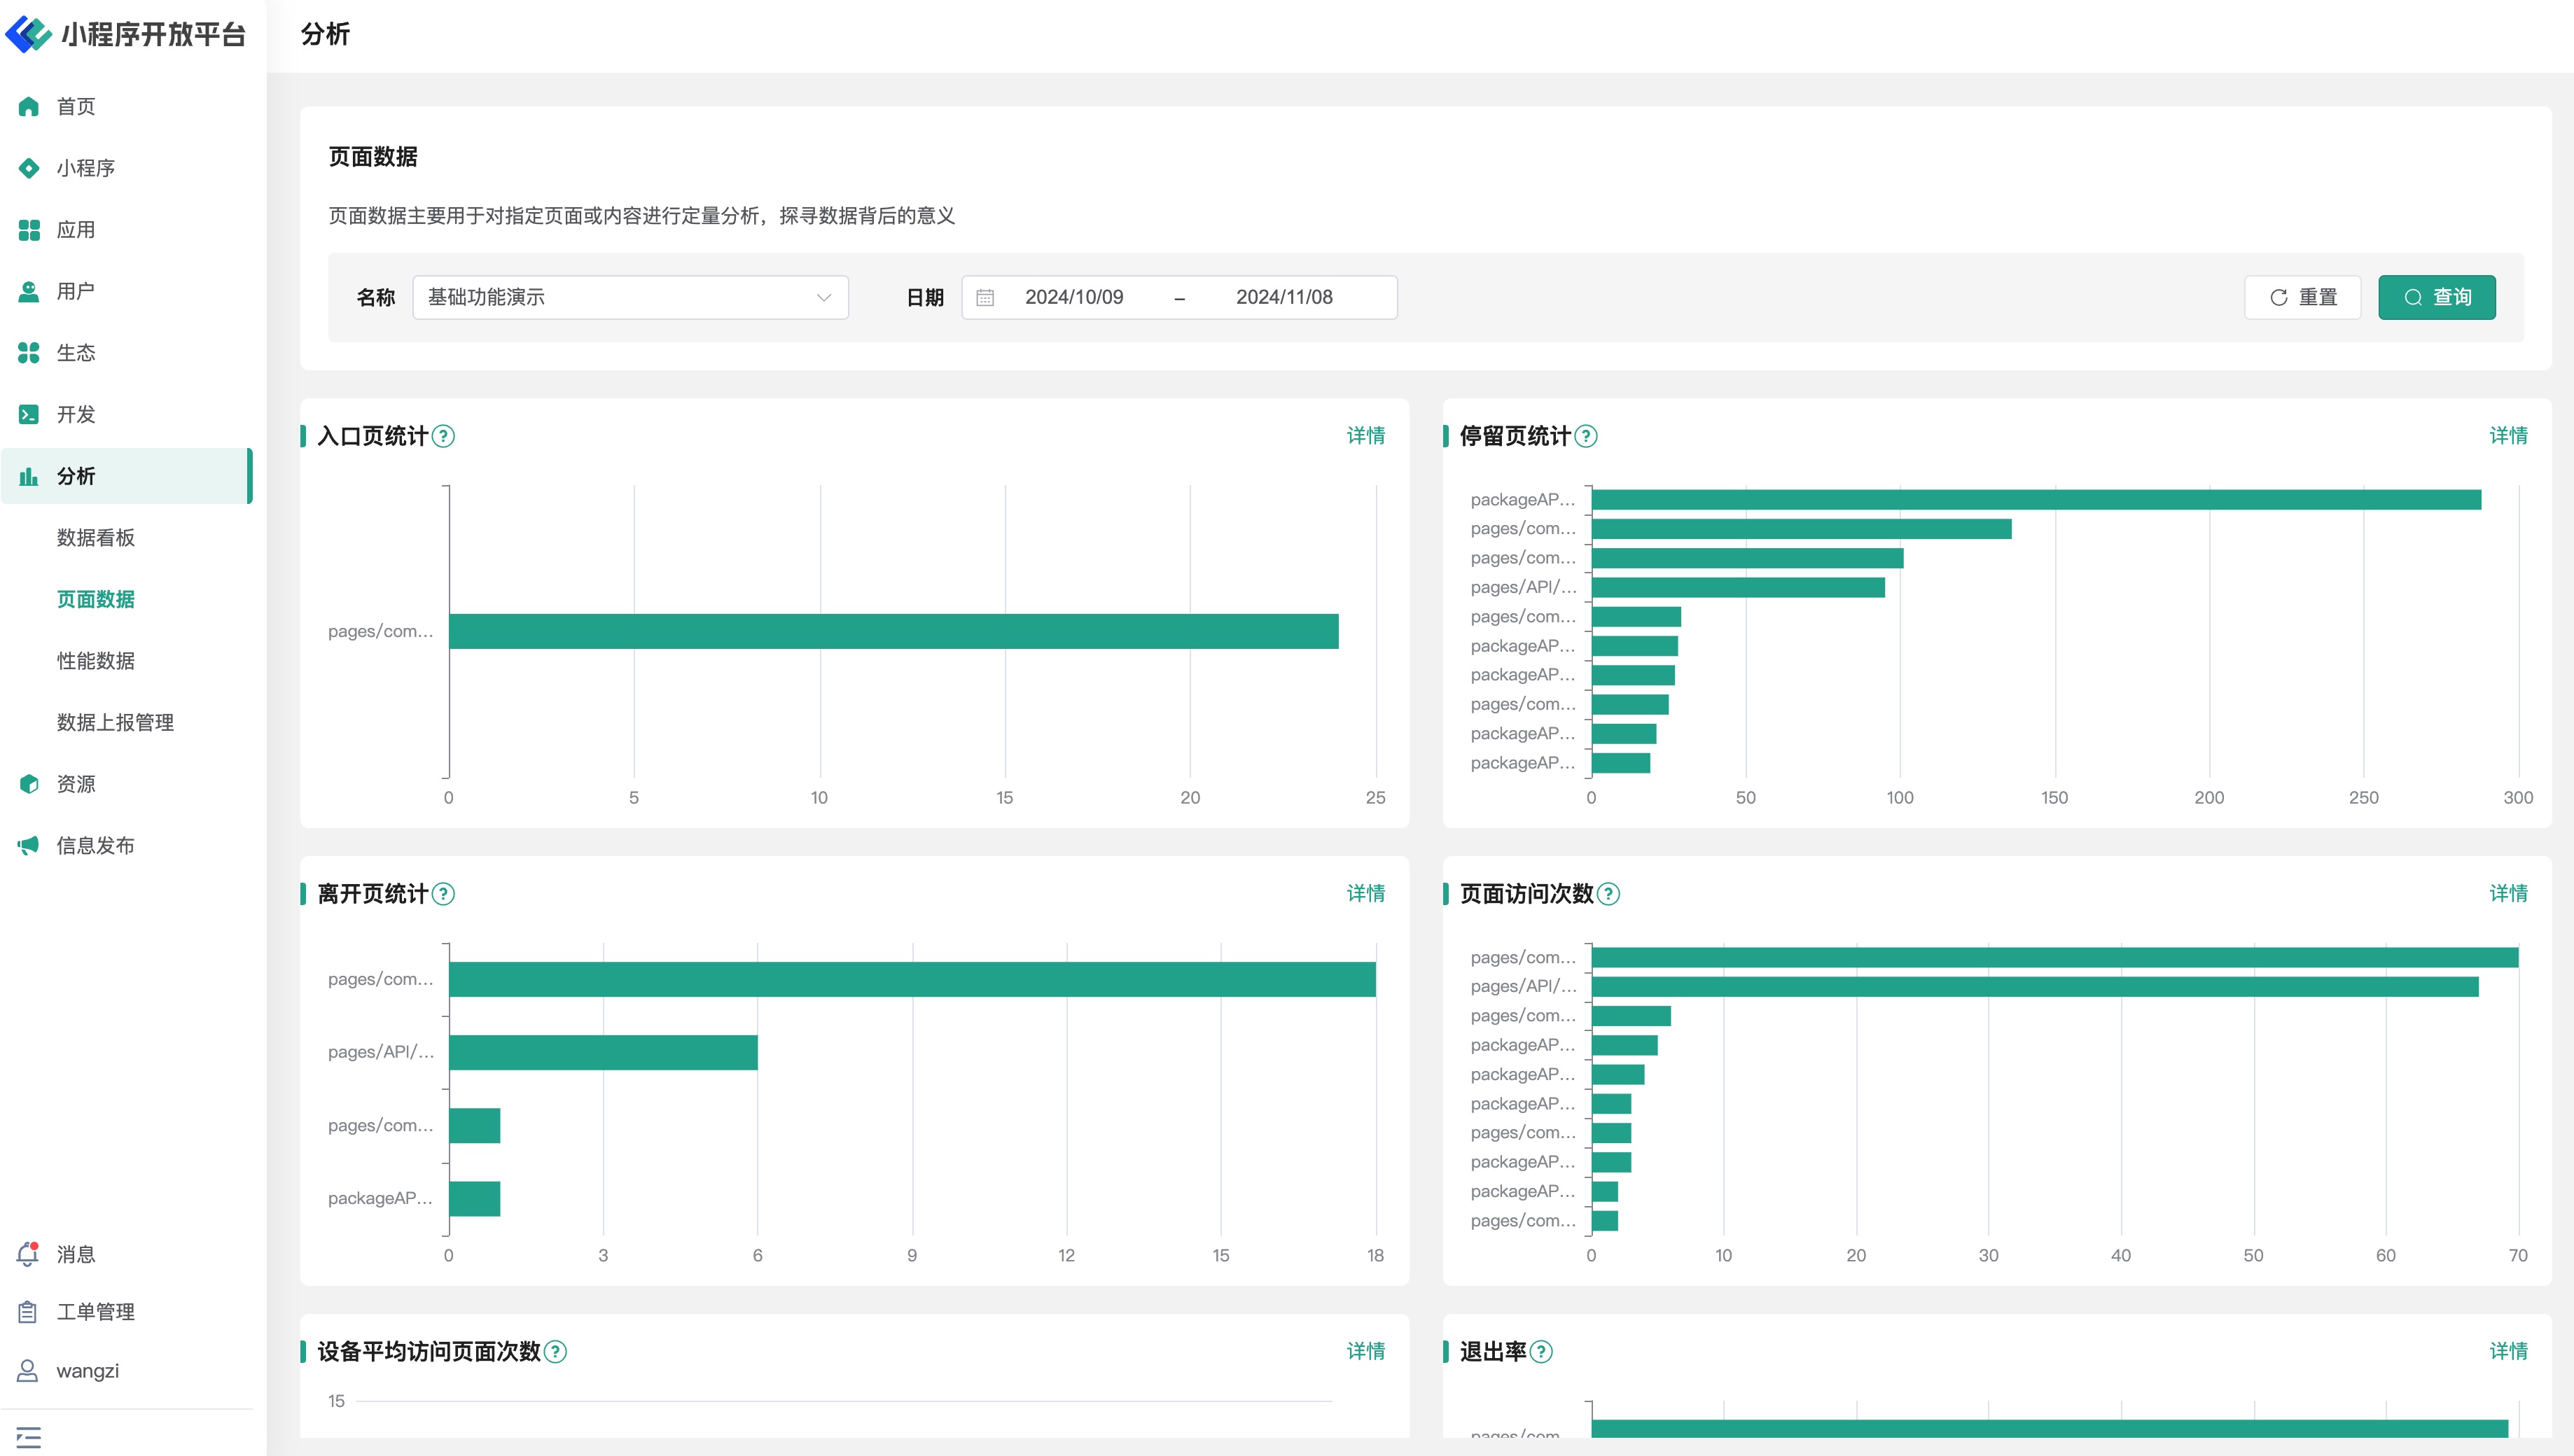
In Page Data statistics, developers can view statistical data filtered by different Mini-Programs or by Mini-Program and time, specifically including:
- Landing Page Statistics: The number of times users entered the Mini-Program via each page during the statistical period, sorted from highest to lowest.
- Dwell Page Statistics: Pages sorted by the average user dwell time during the statistical period, from highest to lowest.
- Exit Page Statistics: The number of times users exited the Mini-Program from each page during the statistical period, sorted from highest to lowest.
- Page Views: The total number of visits to all pages during the statistical period, sorted from highest to lowest.
- Average Page Views per Device: The average number of pages visited per user during the statistical period, sorted from highest to lowest.
- Exit Rate: The proportion of users leaving the Mini-Program from a specific page during the statistical period, sorted from highest to lowest.
Clicking the card details in the upper right corner of the statistical analysis data reveals detailed information distributed by date.
# 3.3 Performance Data
Performance Data provides various officially collected performance metrics, including Mini-Program performance indicators across multiple dimensions such as startup, network, runtime, and experience, as well as comprehensive performance evaluation reports.
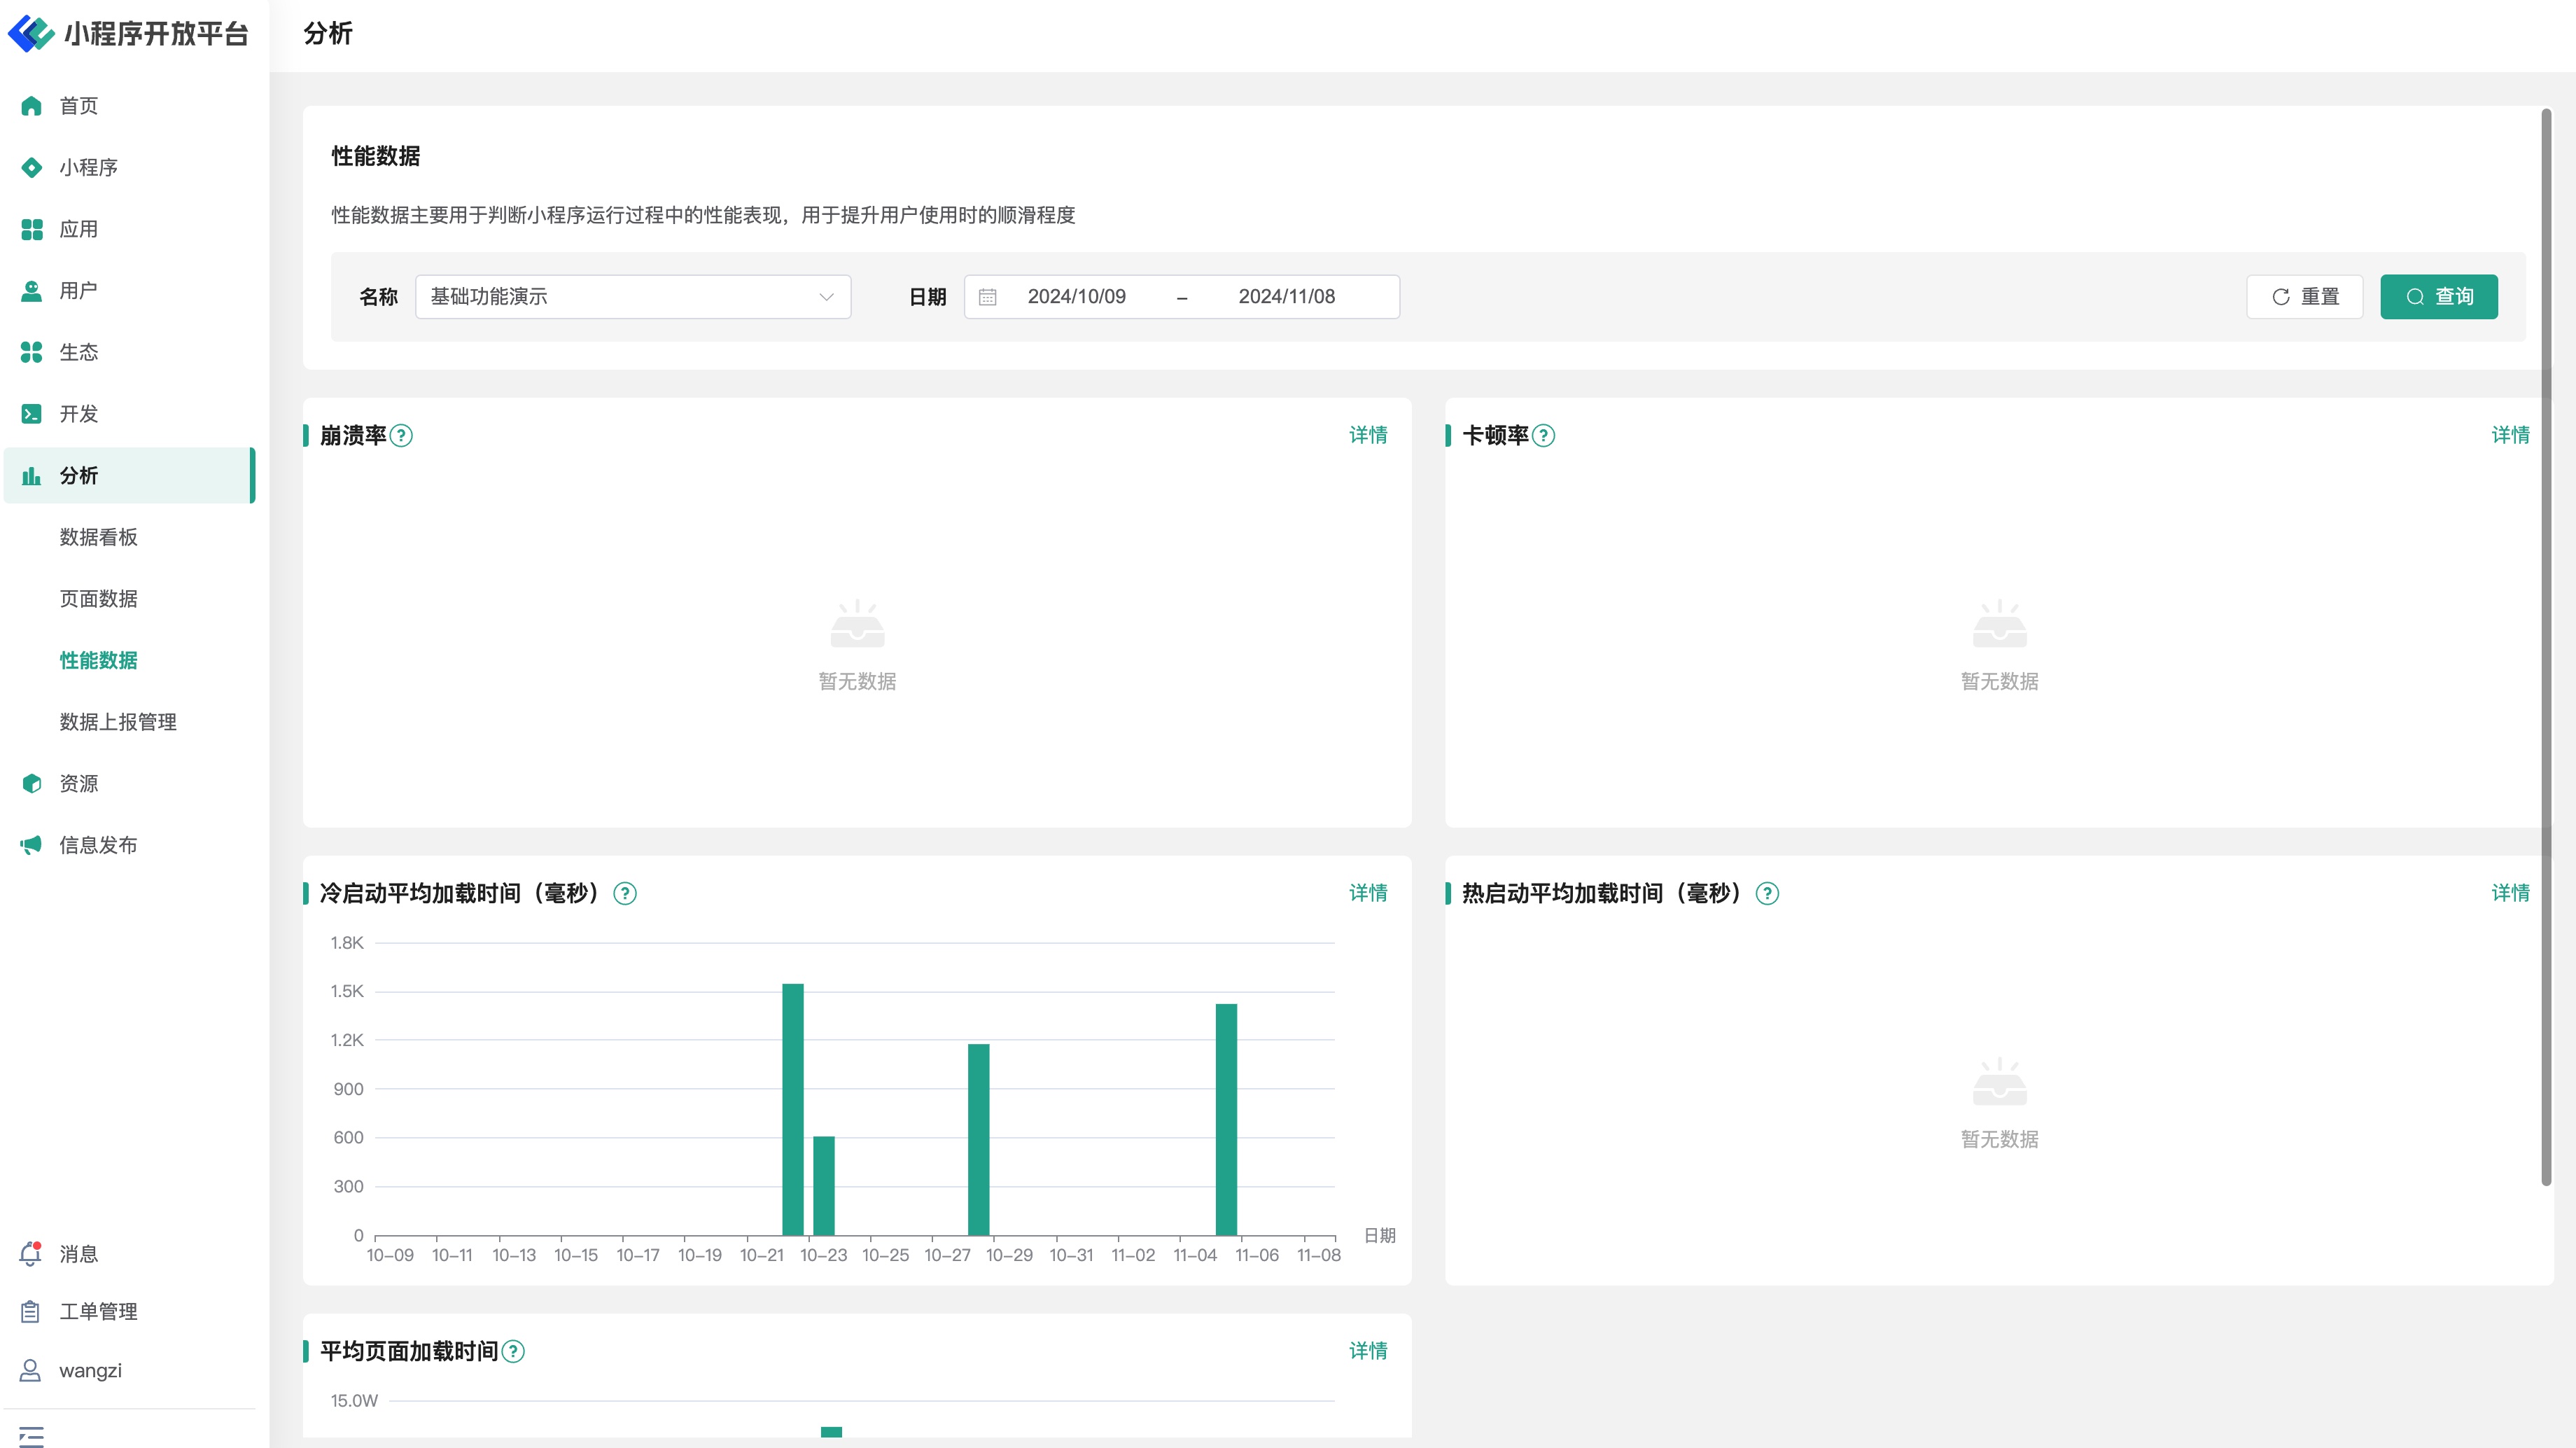
On the Performance Data page, developers can view statistical data filtered by different Mini-Programs or by Mini-Program and time, specifically including:
- Crash Rate: The ratio of crashes to the number of visits during Mini-Program operation.
- Stutter Rate: The ratio of stutters to the number of visits during Mini-Program operation.
- Average Cold Start Load Time (ms): The average time required from cold start to the completion of the first page rendering for the Mini-Program (in milliseconds).
- Average Warm Start Load Time (ms): The average time required from warm start to the completion of the first page rendering for the Mini-Program (in milliseconds).
- Average Page Load Time: The average load time for all pages of the Mini-Program.
Clicking the card details in the upper right corner of the statistical analysis data reveals detailed information distributed by date.
# 3.4 Data Reporting Management
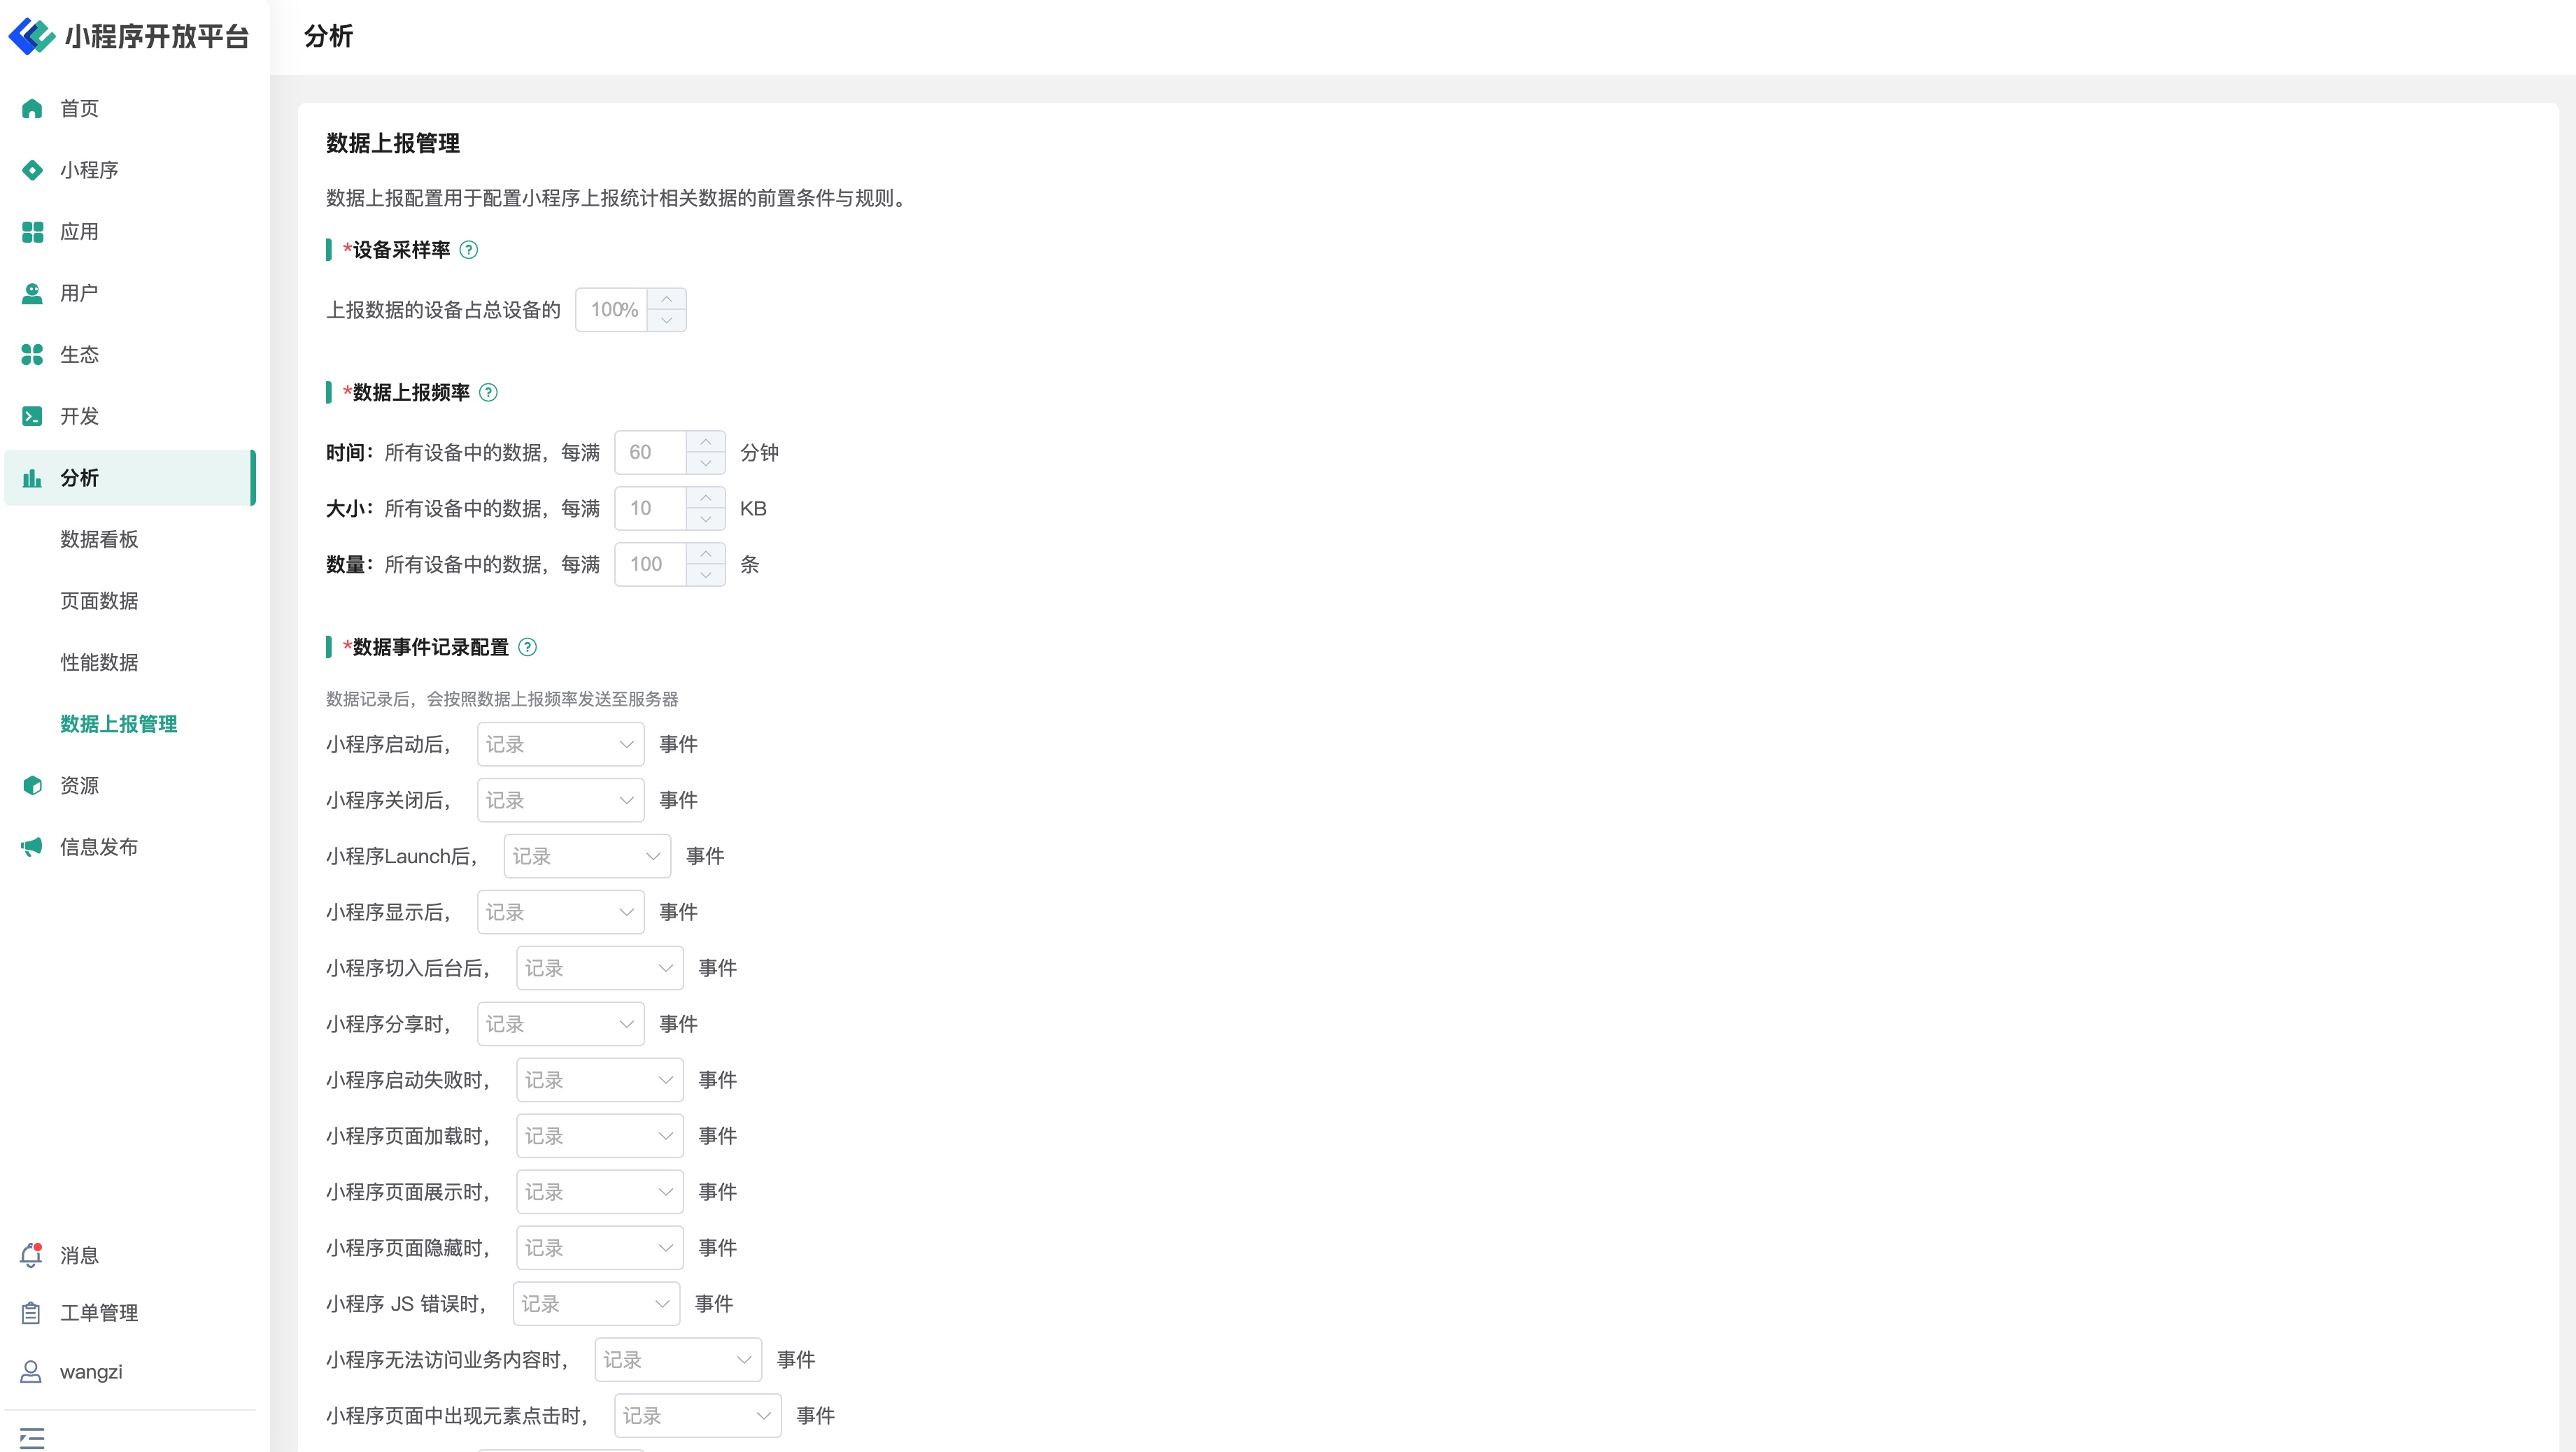
On the Data Reporting Management page, administrators can configure prerequisites and rules for Mini-Program statistical data reporting, such as data reporting frequency, data size, and quantity information. Additionally, the default reporting status for different events can be configured separately based on actual needs.
# 4. Environment Specifications
| Community Edition | SaaS Edition | Enterprise Edition (Annual Subscription or One-time Purchase) | |
|---|---|---|---|
| Statistical Analysis | ❌ | ✅ | ✅ |
| Statistical Analysis (Advanced) | ❌ | ✅ | Available upon request |