
# Operation Center - Statistical Analysis
# 1. Feature Overview
The Statistical Analysis feature is designed to provide developers and enterprises with a powerful data analysis tool, helping them extract valuable insights from massive data, optimize user experience, and drive business growth. Our Statistical Analysis feature includes the following core modules, each designed to be both intuitive and powerful to meet analysis needs at different levels.
# 2. Terminology Definitions
The Statistical Analysis feature includes the following content modules, providing users with detailed and user-friendly analytical capabilities.
| Name | Explanation |
|---|---|
| Data Dashboard | The Data Dashboard is the core of the Statistical Analysis feature, providing an intuitive interface that allows users to quickly understand the key performance indicators of the Mini-Program. Through the Data Dashboard, users can view real-time data, historical trends, user behavior analysis, and other information. The Data Dashboard typically includes charts, numerical dashboards, and key indicator cards, presenting data graphically to help users make data-driven decisions. |
| Page Data | The Page Data statistics module focuses on tracking and analyzing user behavior on various pages of the Mini-Program. It records key metrics such as page visits, dwell time, and bounce rate, helping developers understand which pages are the most popular, how much time users spend on each page, and how frequently users leave the page. This data is crucial for optimizing page layout and improving user experience (This feature belongs to the Advanced Statistical Analysis feature). |
| Performance Data | The Performance Data statistics module monitors the Mini-Program's loading time, response speed, and other performance-related metrics. Through this data, developers can identify performance bottlenecks, optimize code and resources, thereby improving the overall performance and user experience of the Mini-Program (This feature belongs to the Advanced Statistical Analysis feature). |
| Event Statistics | The Event Statistics module allows developers to track specific events triggered by users within the Mini-Program, such as button clicks, form submissions, etc. By analyzing the frequency of these events and related user behaviors, developers can better understand user needs and preferences, thereby optimizing feature design and increasing user engagement (This feature belongs to the Advanced Statistical Analysis feature). |
| Funnel Analysis | The Funnel Analysis module focuses on the analysis of conversion paths, helping developers understand the user conversion process from entering the Mini-Program to completing a specific goal (such as purchase, registration). By analyzing each stage of the conversion funnel, developers can identify points of user drop-off and take corresponding measures to improve the conversion rate (This feature belongs to the Advanced Statistical Analysis feature). |
| JS Analysis | The JS Analysis module focuses on monitoring the execution of JavaScript code within the Mini-Program. It helps developers identify script errors, performance issues, and resource loading problems, thereby optimizing code and improving the stability and responsiveness of the Mini-Program (This feature belongs to the Advanced Statistical Analysis feature). |
| Real-time Logs | The Real-time Logs module provides a window to monitor the operational status of the Mini-Program in real-time. Developers can use this module to view user operation logs, system errors, and other critical events, enabling quick response and resolution of potential issues. Real-time logs are essential for quickly locating and fixing problems (This feature belongs to the Advanced Statistical Analysis feature). |
# 3. Usage Instructions
# 3.1 Data Dashboard
The Data Dashboard module provides users with an interface that centrally displays Key Performance Indicators (KPIs). On the page, you can view aggregated data for all Mini-Programs or core data filtered by Mini-Program and time.
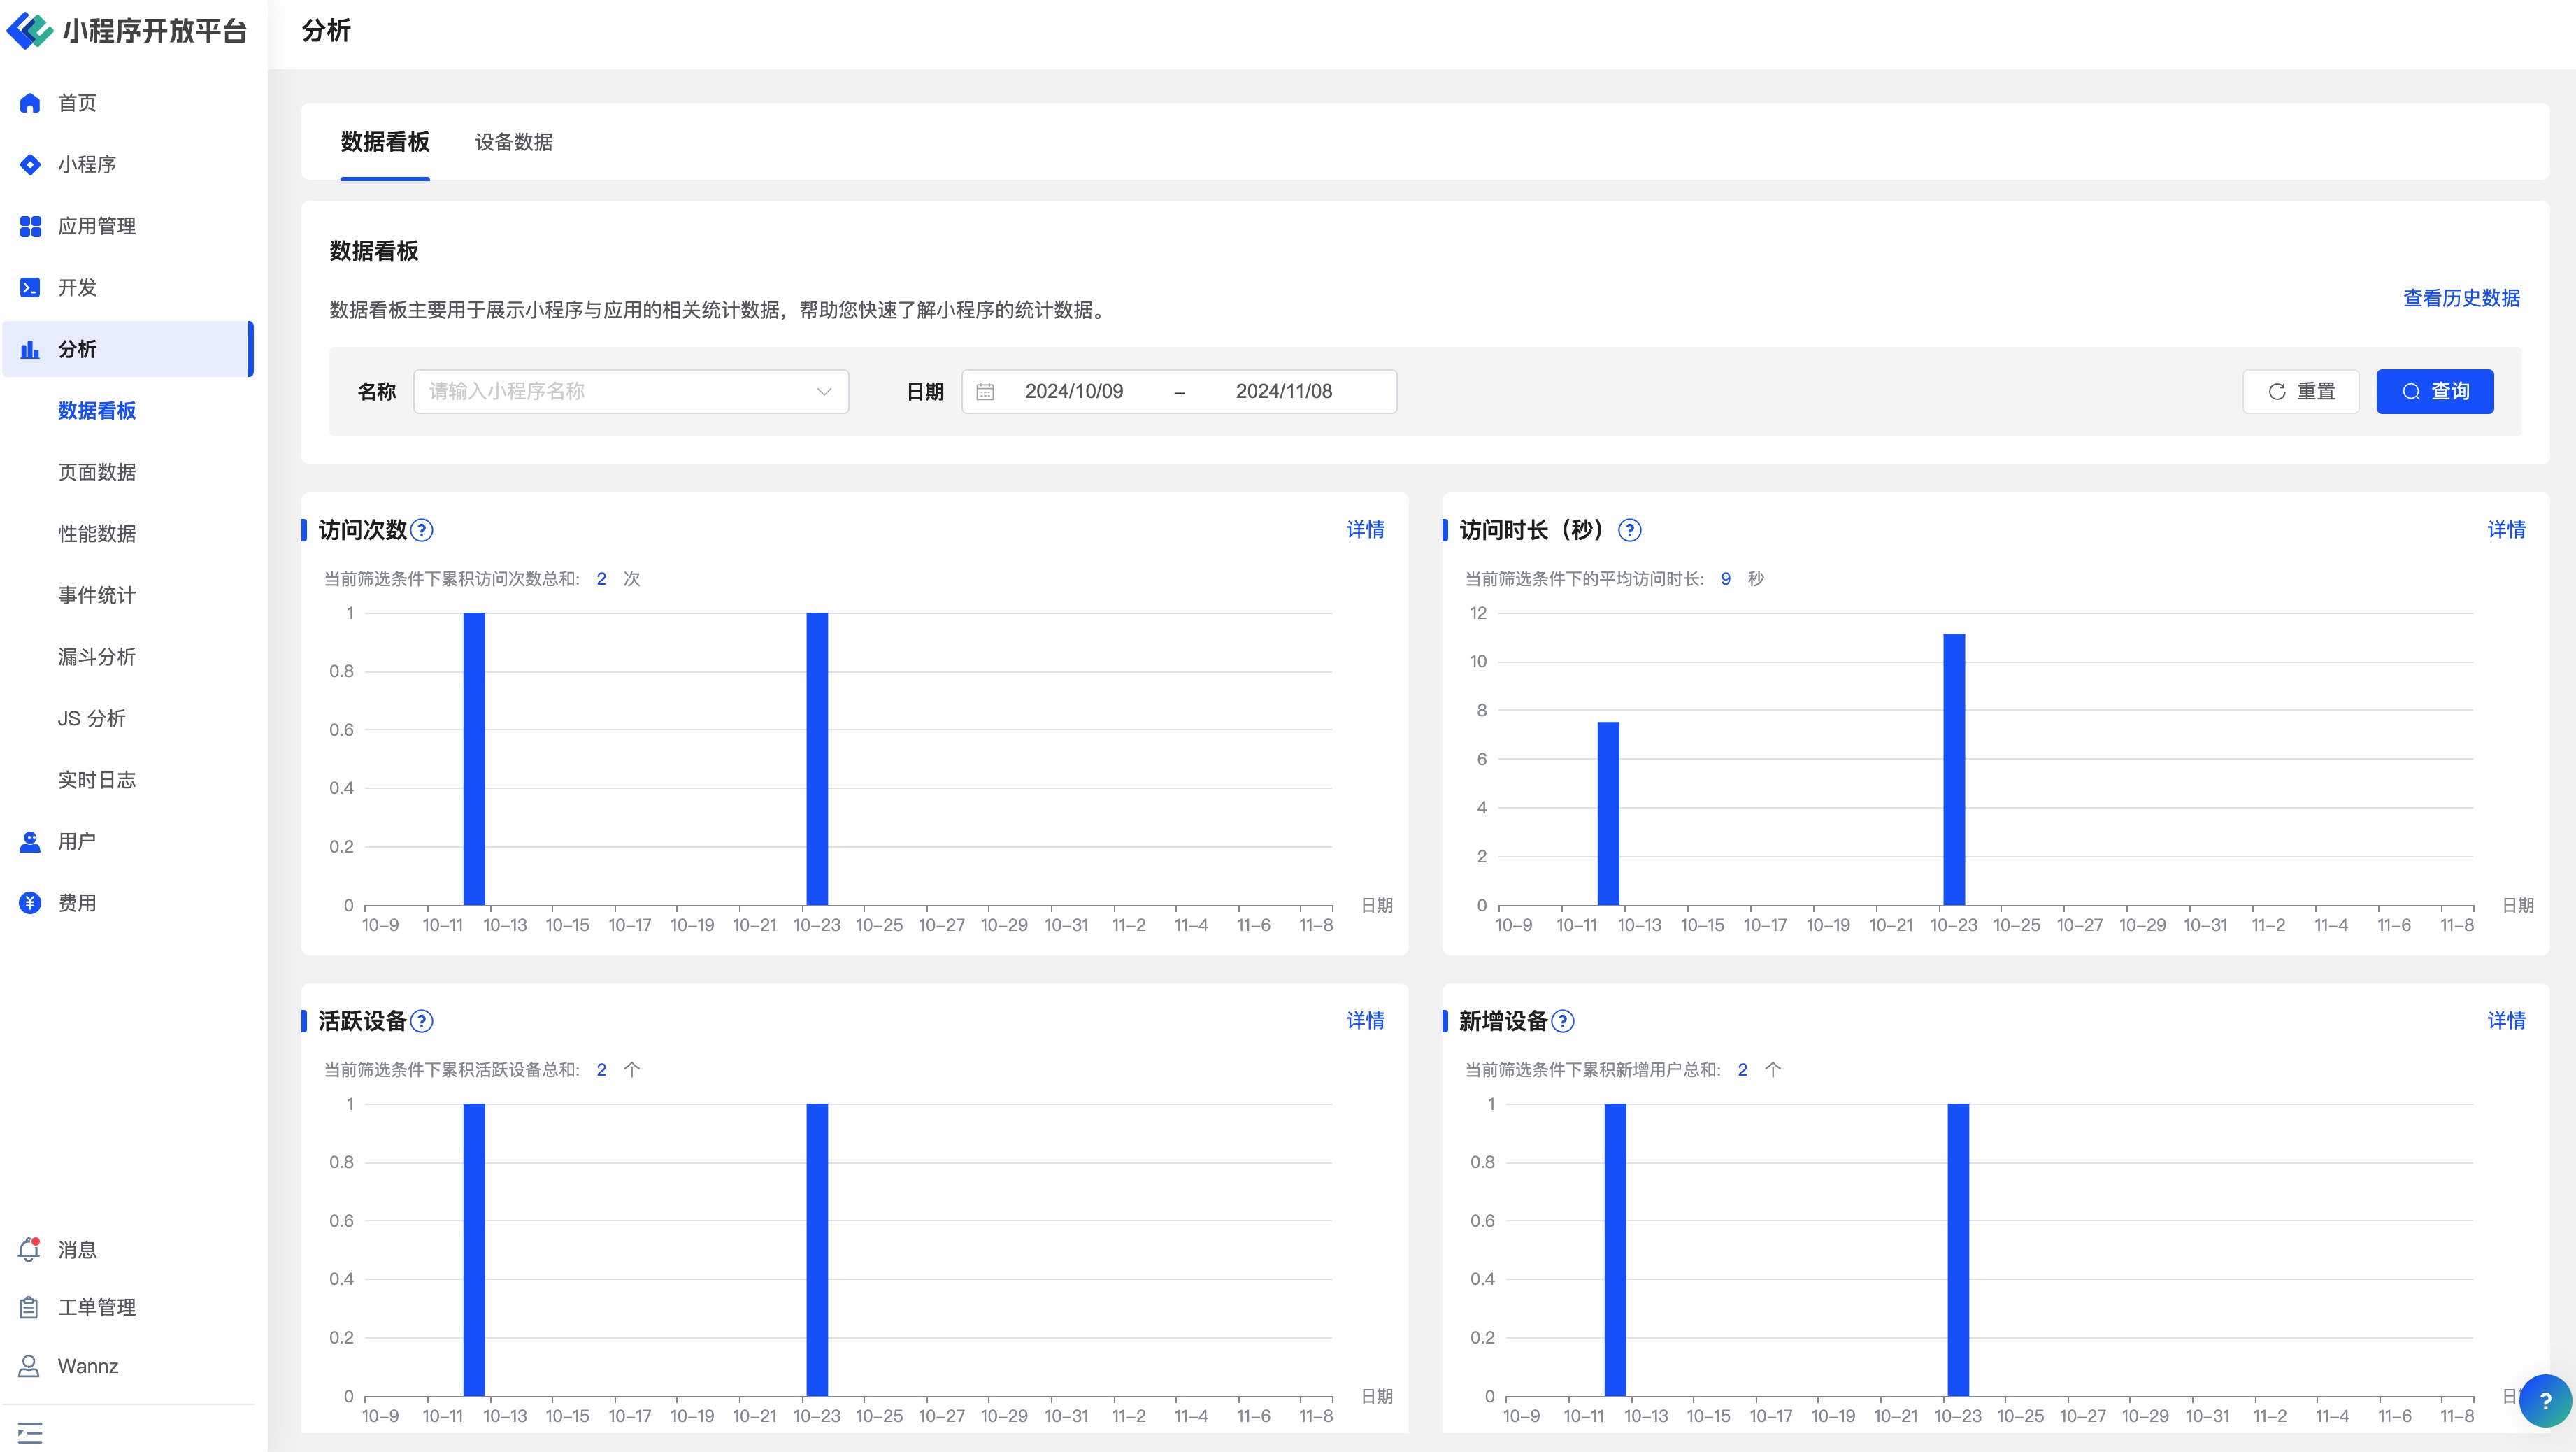
The core data includes:
- Number of Visits: The total number of visits to the Mini-Program over a specified period.
- Average Visit Duration (seconds): The average duration of each user visit to the Mini-Program.
- Active Devices: The number of active users over a specified period.
- New Devices: The number of new users over a specified period.
- User Source (Application): Data on the source of visits (traffic from different applications).
- User Source (Region): Geographic source of users (province, city, etc.).
On the Data Dashboard page, you can also click the tabs at the top to view device data information based on different Mini-Programs.
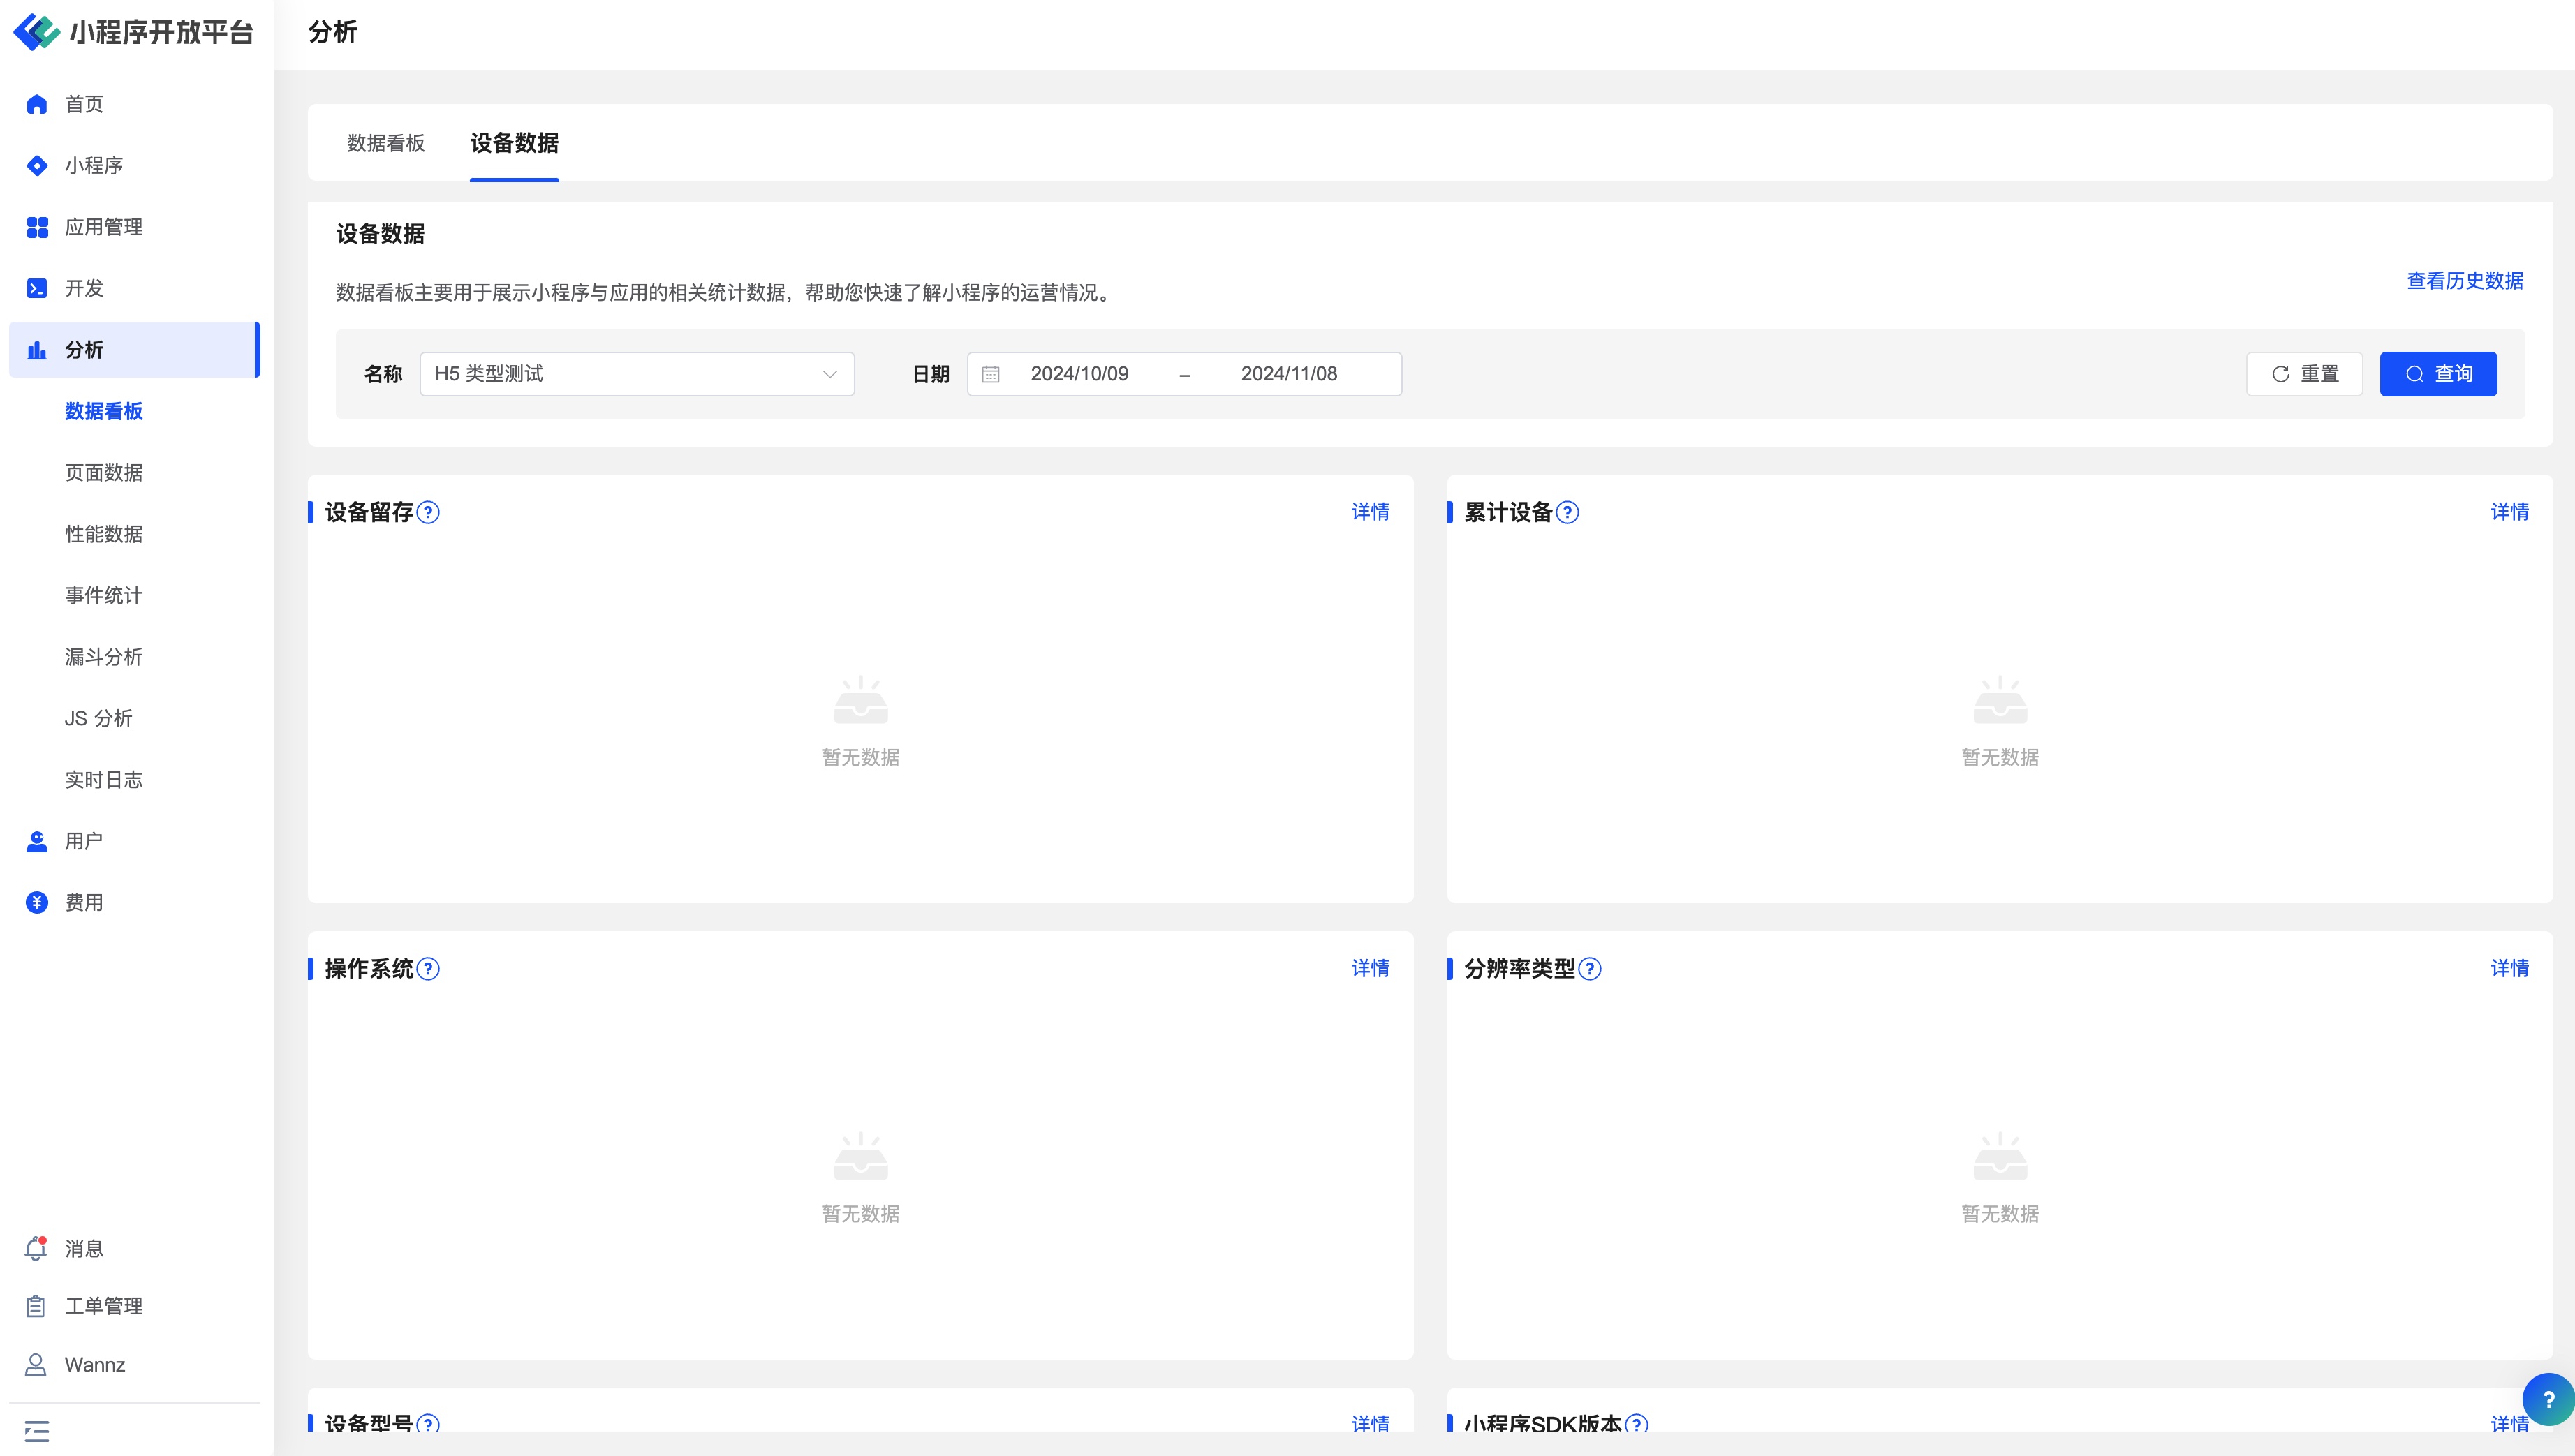
The device data includes:
- Device Retention: The device retention rate over a specified period, which can be calculated for different time intervals (e.g., 1-day retention, 7-day retention, 30-day retention).
- Cumulative Devices: The total number of cumulative devices over a specified period.
- Operating System: The operating system (iOS, Android, etc.).
- Resolution Type: Screen resolution (phone, tablet, etc.).
- Device Model: The model of the mobile device running the Mini-Program.
- Mini-Program SDK Version: Statistical information about the version of the Mini-Program SDK.
- Mini-Program Base Library Version: Statistical information about the version of the Mini-Program SDK's Base Library.
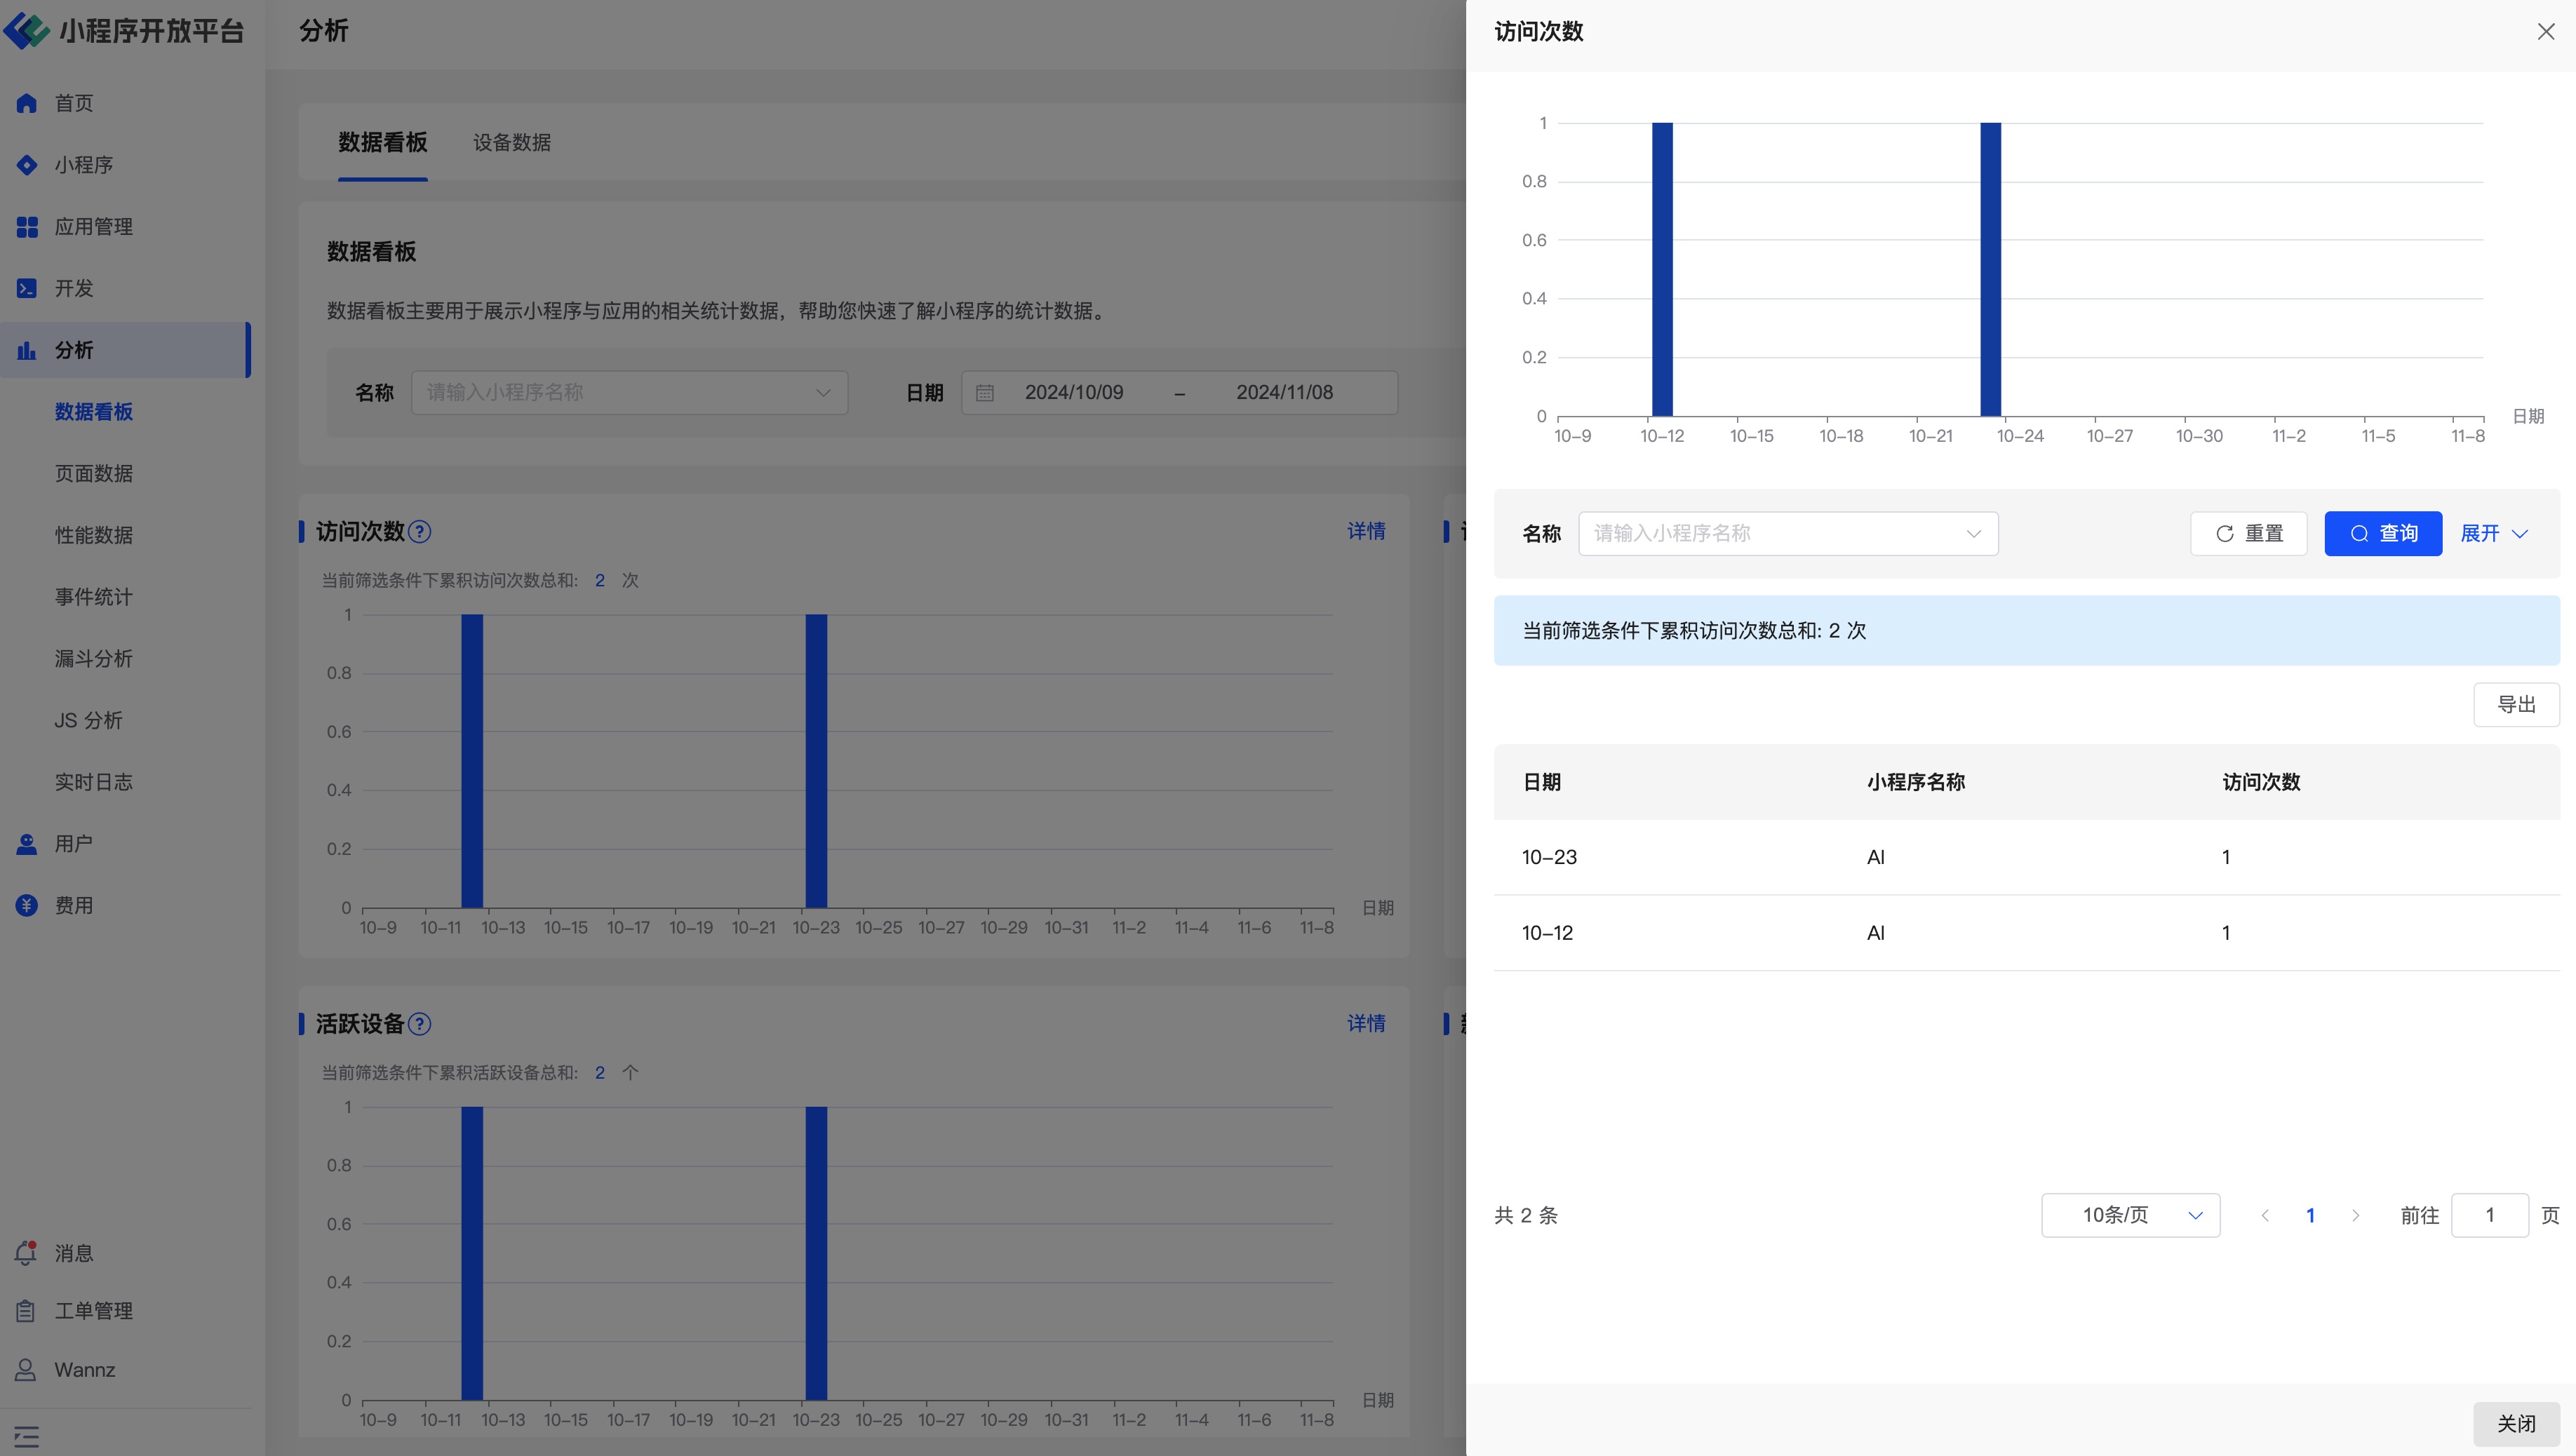 Click the card details in the upper right corner of the statistical analysis data to see detailed information distributed by date.
# 3.2 Page Data
Page Data is the most fundamental concept in daily Mini-Program analysis. The related statistical indicators in Page Data are all based on the "page path" level (Path level). If you need to statistically analyze page visit data at the "parameter" level (Query level), you can report the relevant data and use the Event Statistics function for corresponding statistical processing.
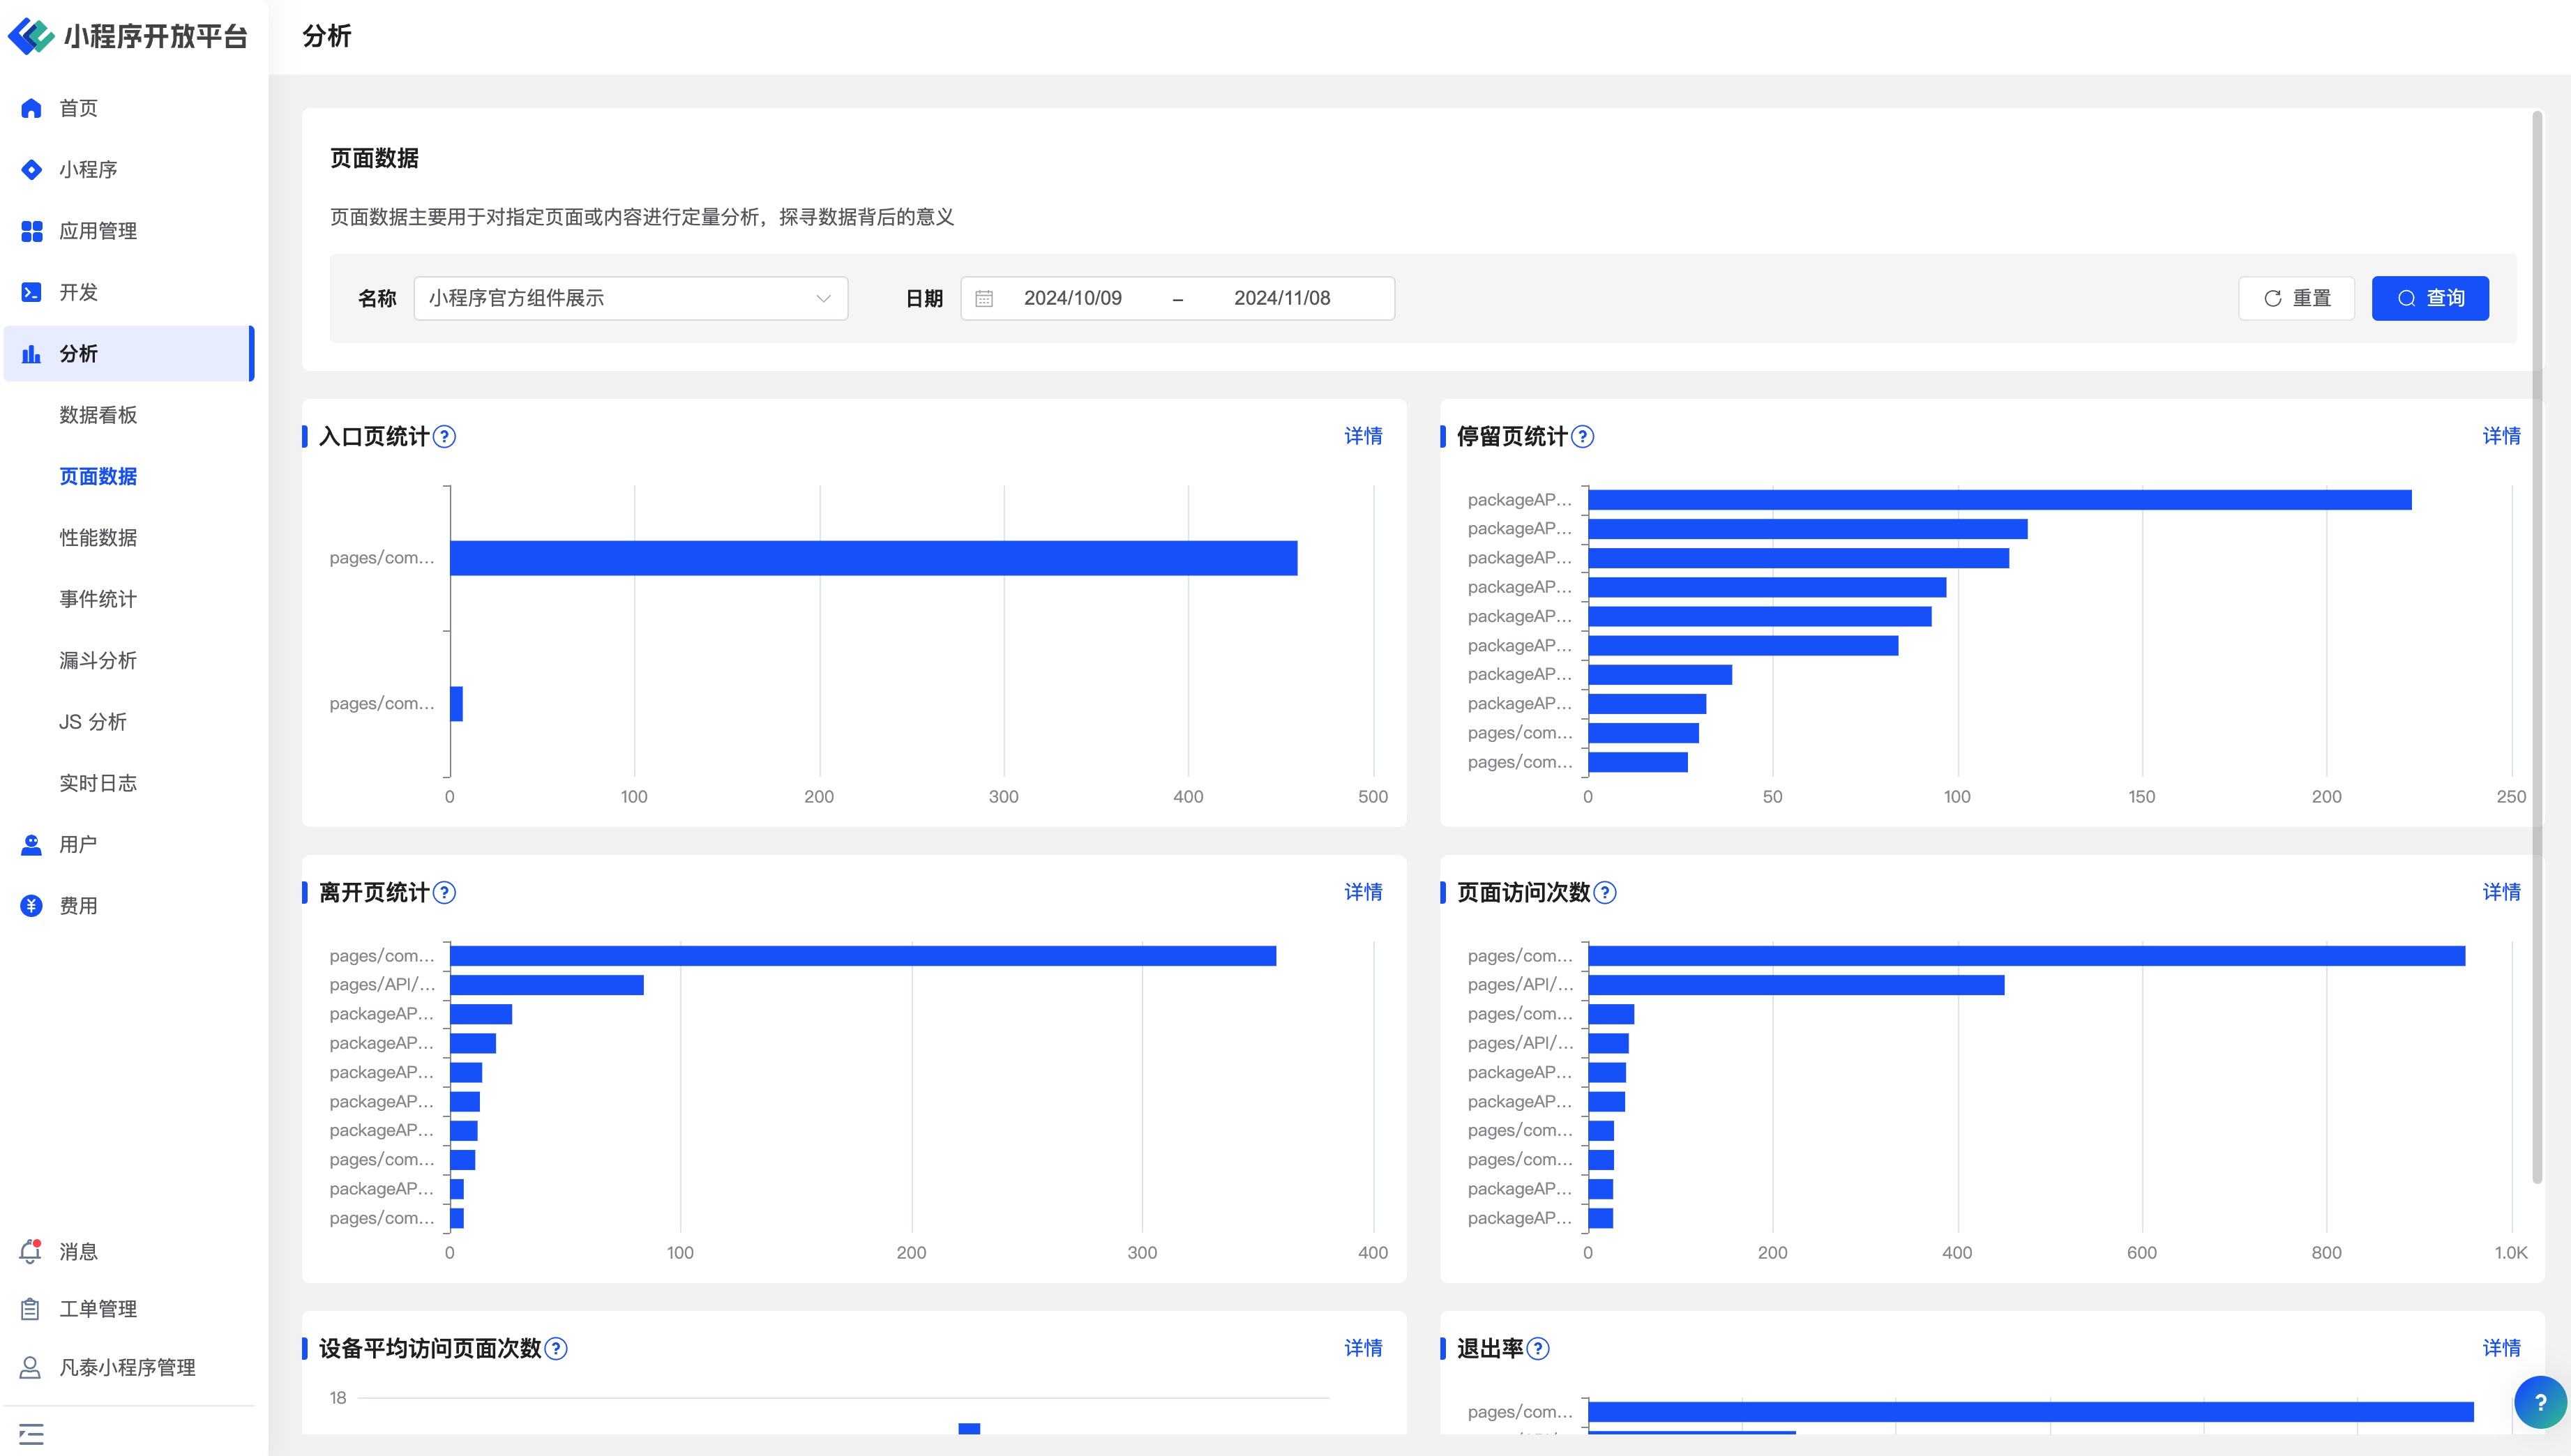
In Page Data statistics, developers can view page statistics filtered by different Mini-Programs or by Mini-Program and time, specifically including:
- Entry Page Statistics: During the statistical period, the number of times users entered the Mini-Program's first page, sorted from high to low.
- Dwell Page Statistics: During the statistical period, the dwell time of users entering the Mini-Program, sorted from high to low.
- Exit Page Statistics: During the statistical period, the number of times users visited the last page, sorted from high to low.
- Page Visits: During the statistical period, the total number of visits to all pages, sorted from high to low.
- Average Page Visits per Device: During the statistical period, the average number of pages visited per user, sorted from high to low.
- Exit Rate: During the statistical period, the proportion of users leaving the Mini-Program from a specific page, sorted from high to low.
Click the card details in the upper right corner of the statistical analysis data to see detailed information distributed by date.
# 3.3 Performance Data
Performance Data is used to provide various official performance statistics, including Mini-Program performance metrics across multiple dimensions such as startup, network, operation, and experience, as well as comprehensive performance evaluation reports.
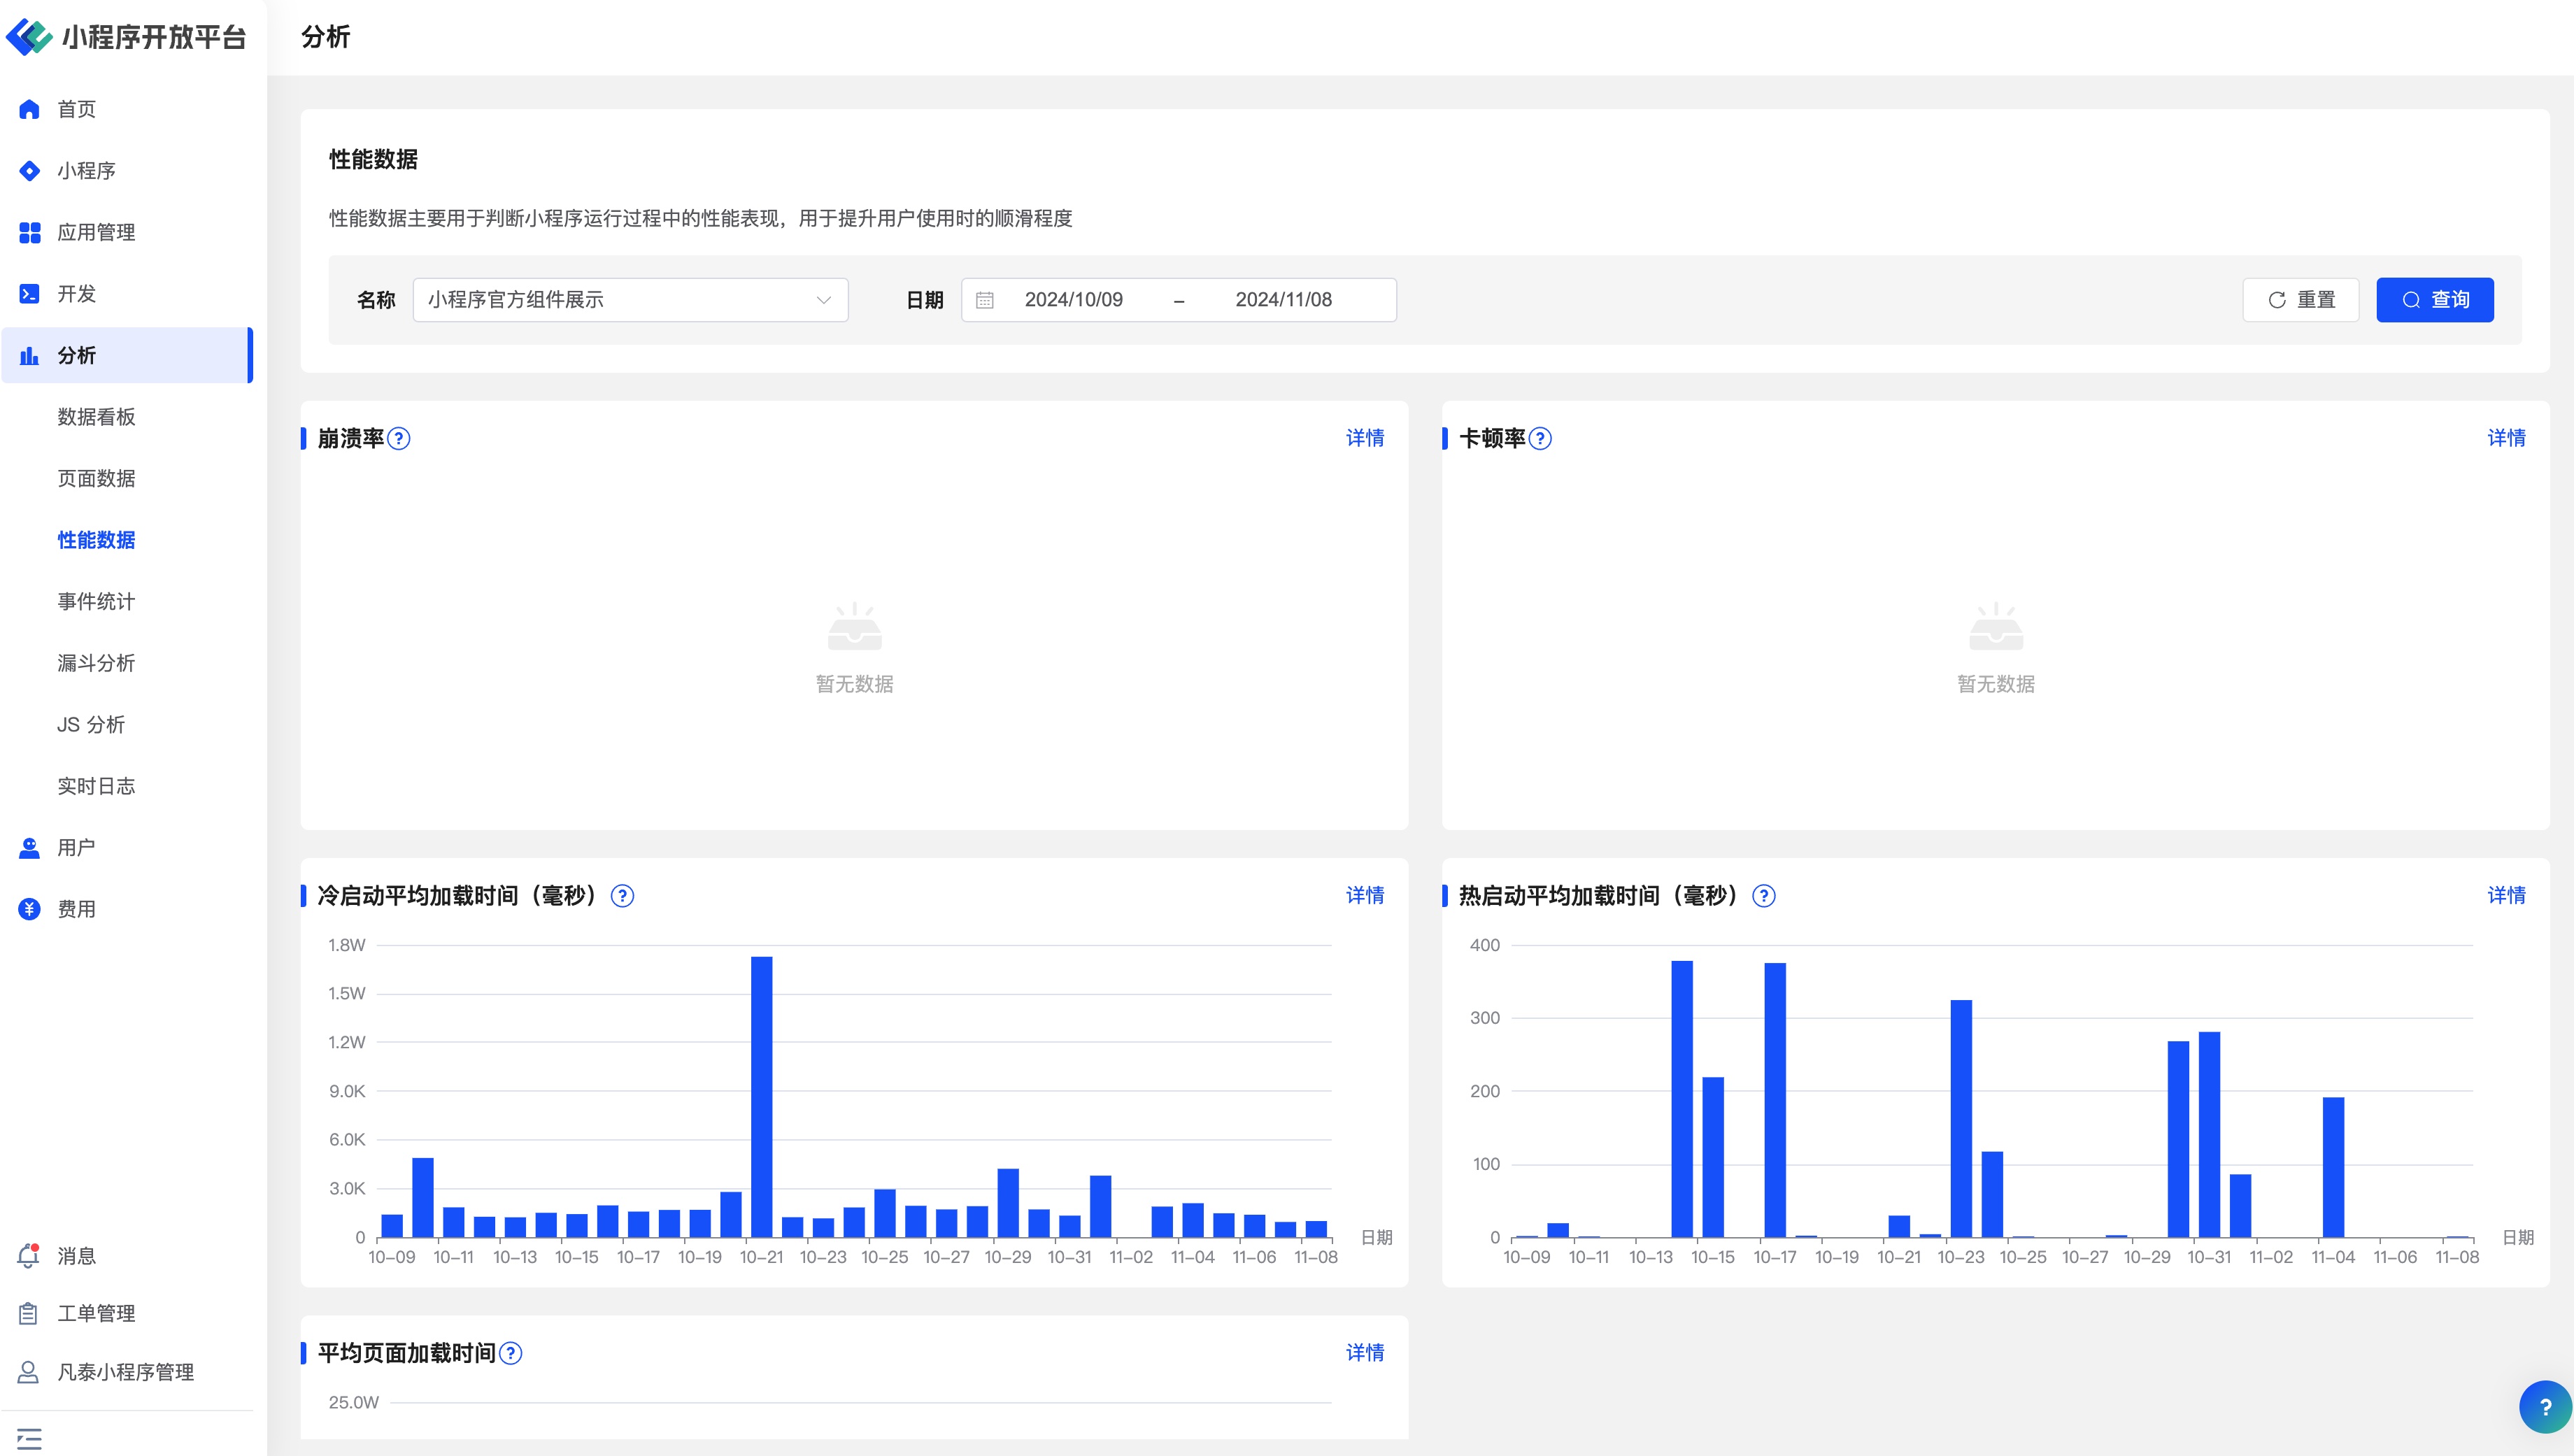
On the Performance Data page, developers can view performance statistics filtered by different Mini-Programs or by Mini-Program and time, specifically including:
- Crash Rate: The ratio of the number of crashes during Mini-Program operation to the number of visits.
- Stutter Rate: The ratio of the number of stutters during Mini-Program operation to the number of visits.
- Average Cold Start Loading Time (ms): The average time required for a Mini-Program's cold start from initiation to the completion of the first page render (in milliseconds).
- Average Warm Start Loading Time (ms): The average time required for a Mini-Program's warm start from initiation to the completion of the first page render (in milliseconds).
- Average Page Loading Time: The average loading time for all pages of the Mini-Program.
Click the card details in the upper right corner of the statistical analysis data to see detailed information distributed by date.
# 3.4 Event Statistics
Event Analysis refers to query analysis based on event indicators, attribute grouping, condition filtering, and other functions. In the Event Analysis function, users can reasonably configure tracking events and attributes according to product characteristics, unleashing the powerful potential of event analysis to answer various segmented questions about trend changes and dimensional comparisons.
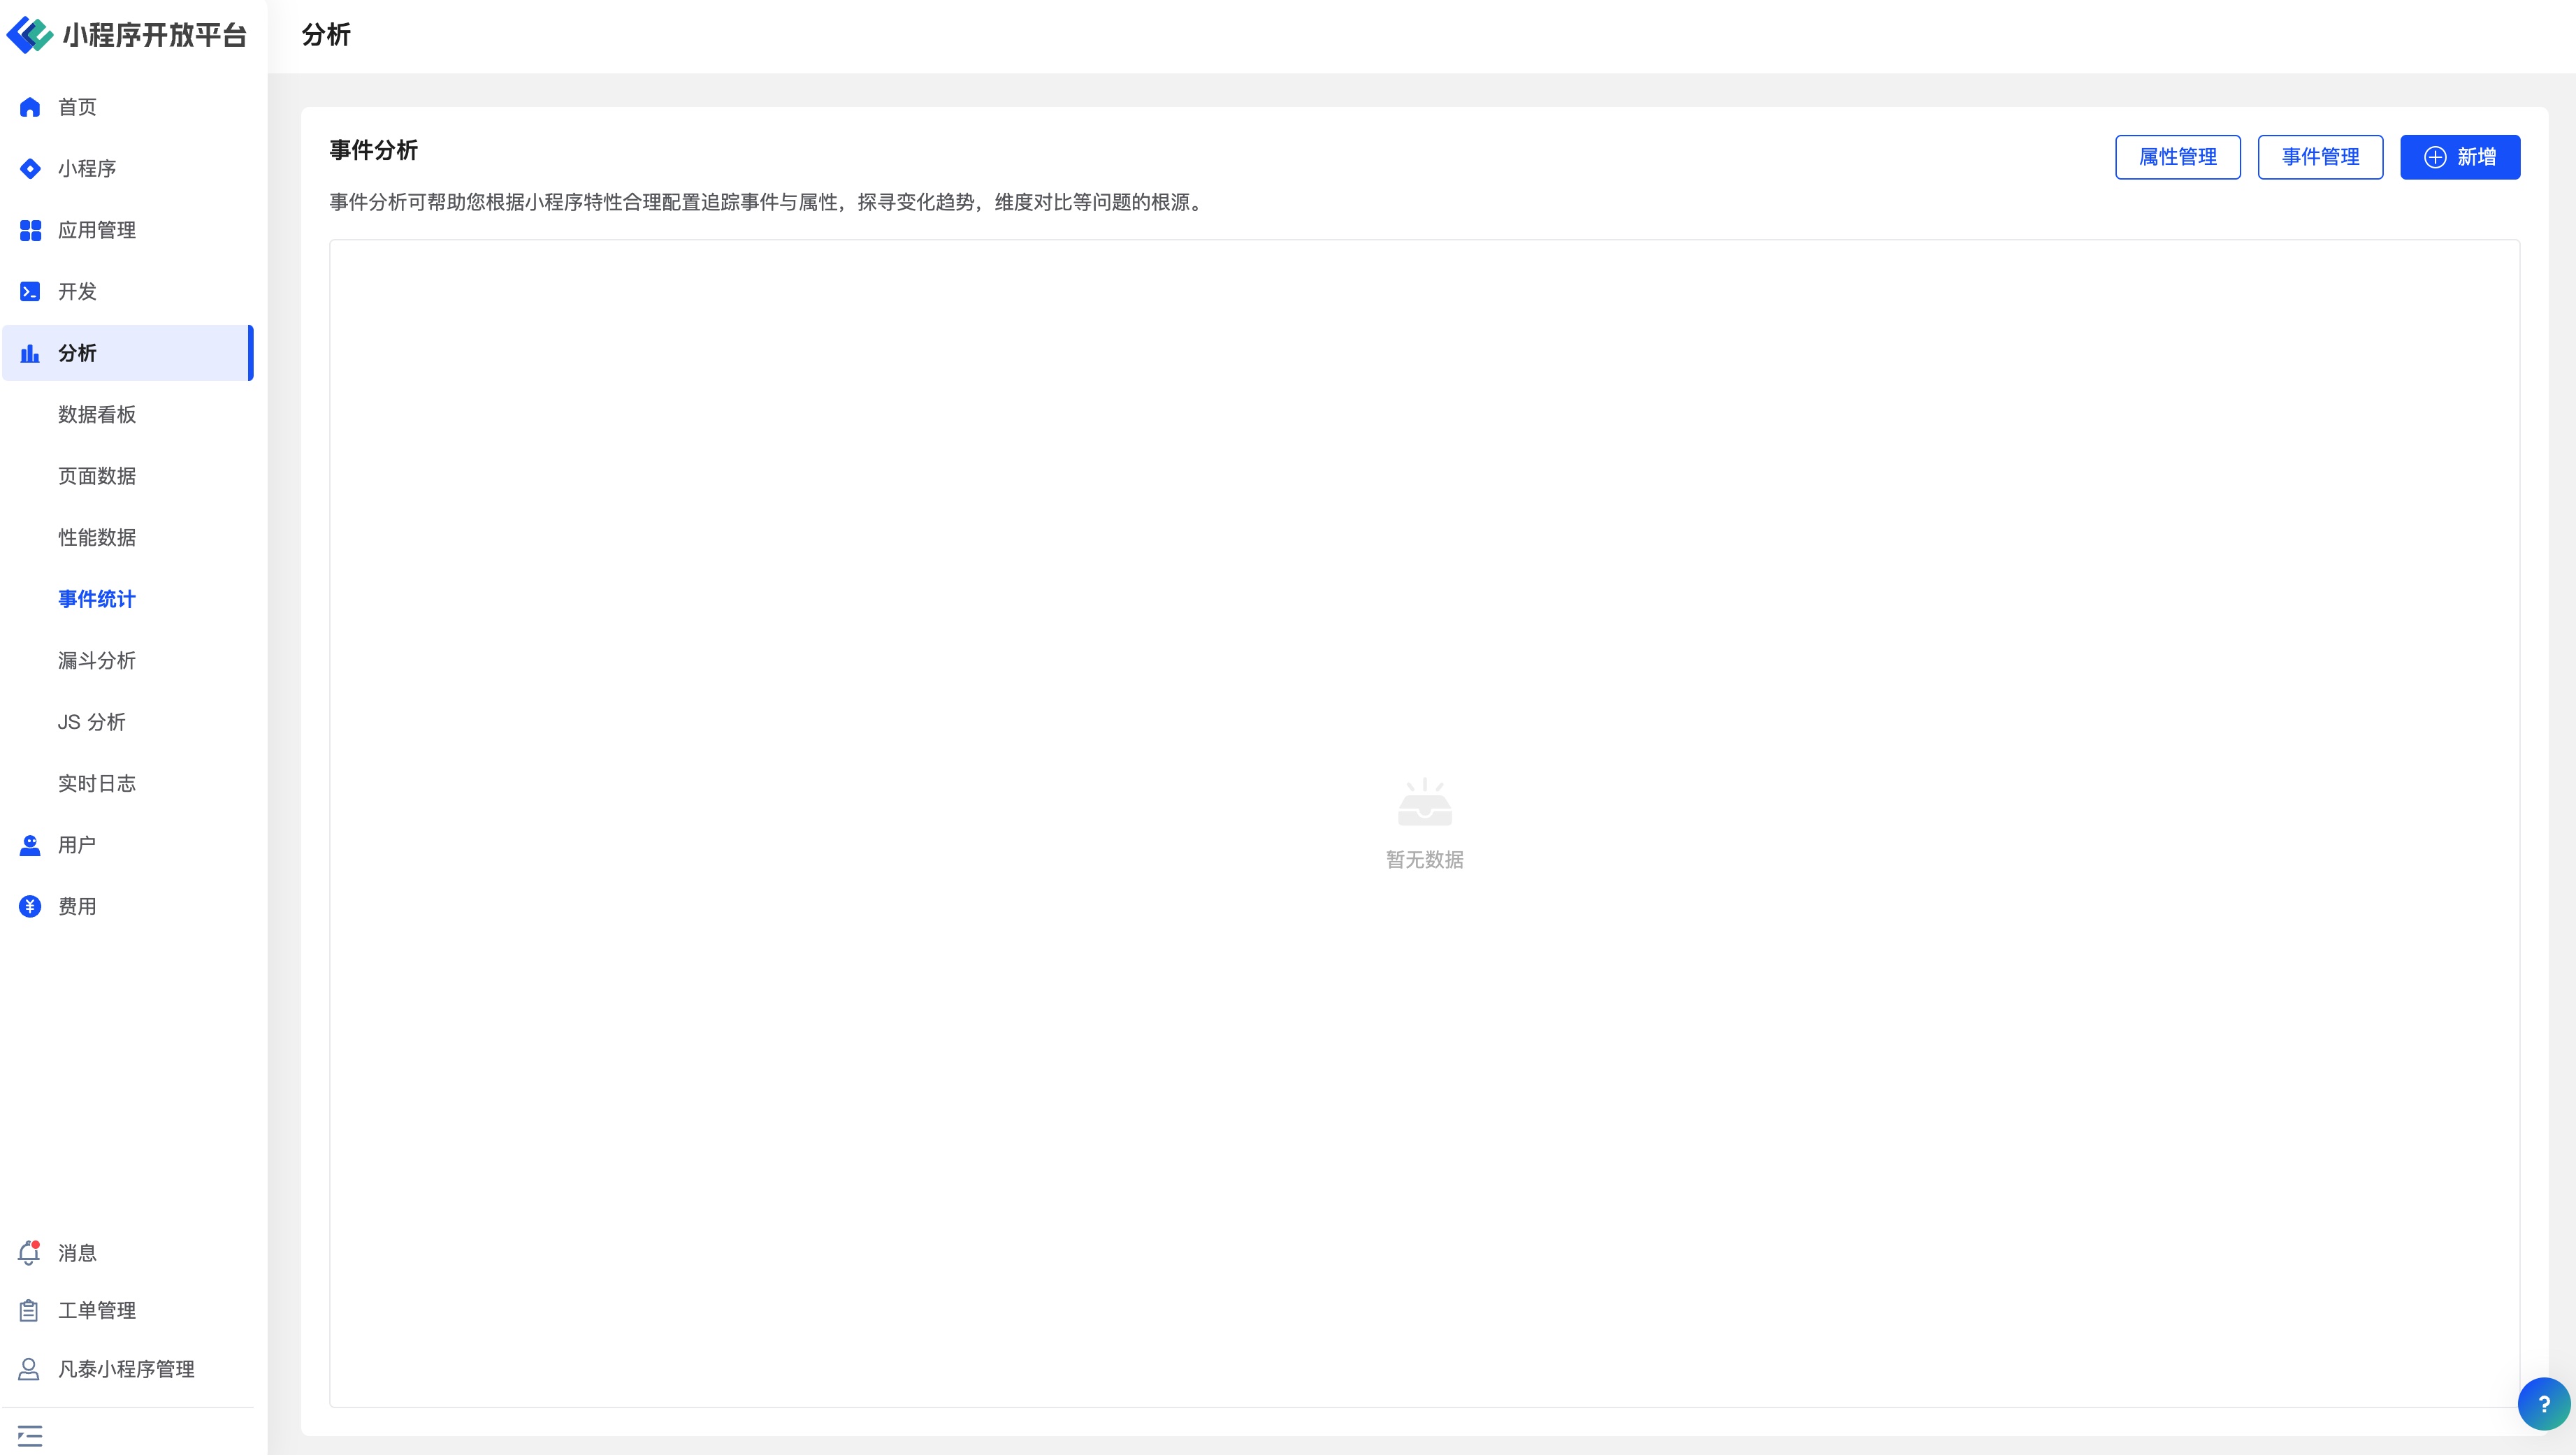
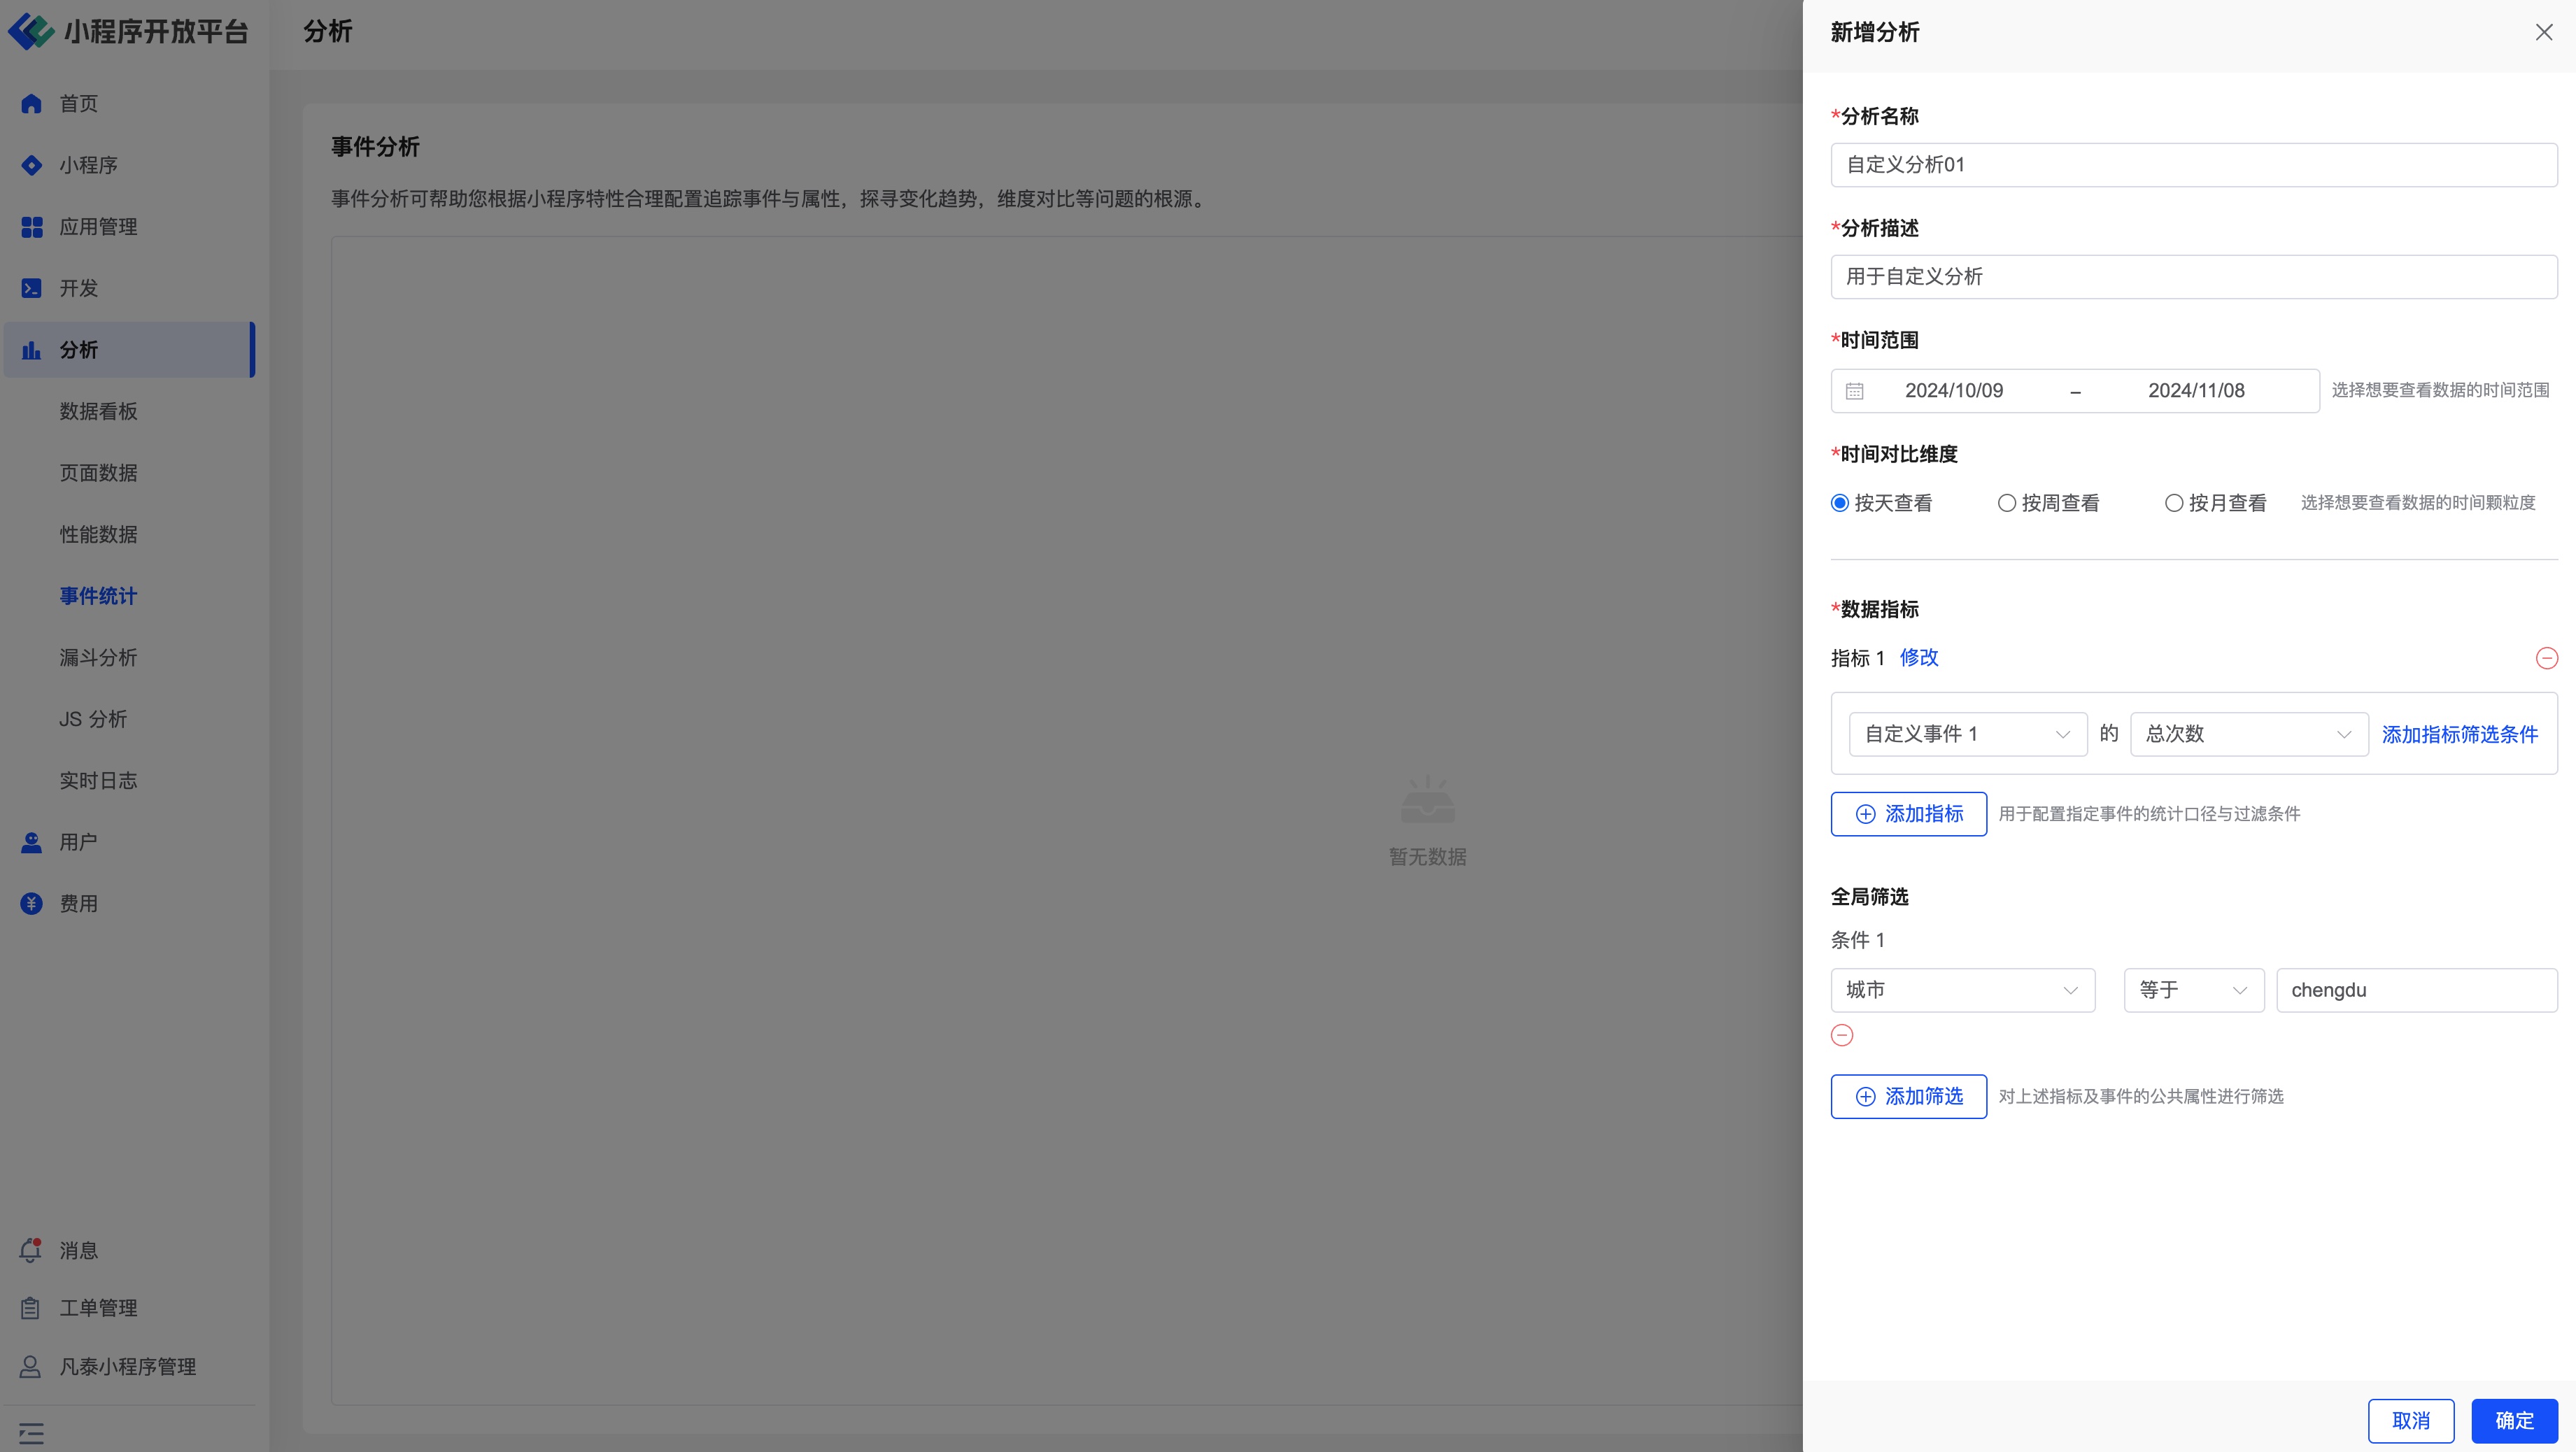
Click the "Add" button in the upper right corner of the page, and select the event and the single or multiple indicators to analyze from the dropdown menus. All events can analyze the following indicators:
- Total Count: The number of times the event was triggered within the selected time range.
- Number of Devices: The number of unique devices that triggered the event within the selected time range.
- Average Count per Device: The average number of times the event was triggered per unique device within the selected time range.
After creation, click "View Data" in the table to browse the daily organized indicator information for that analysis.
In addition to the default events provided by FinClip, Mini-Program developers can define relevant events in their code and perform further analysis based on them.
# Events and Attributes (Custom Reporting)
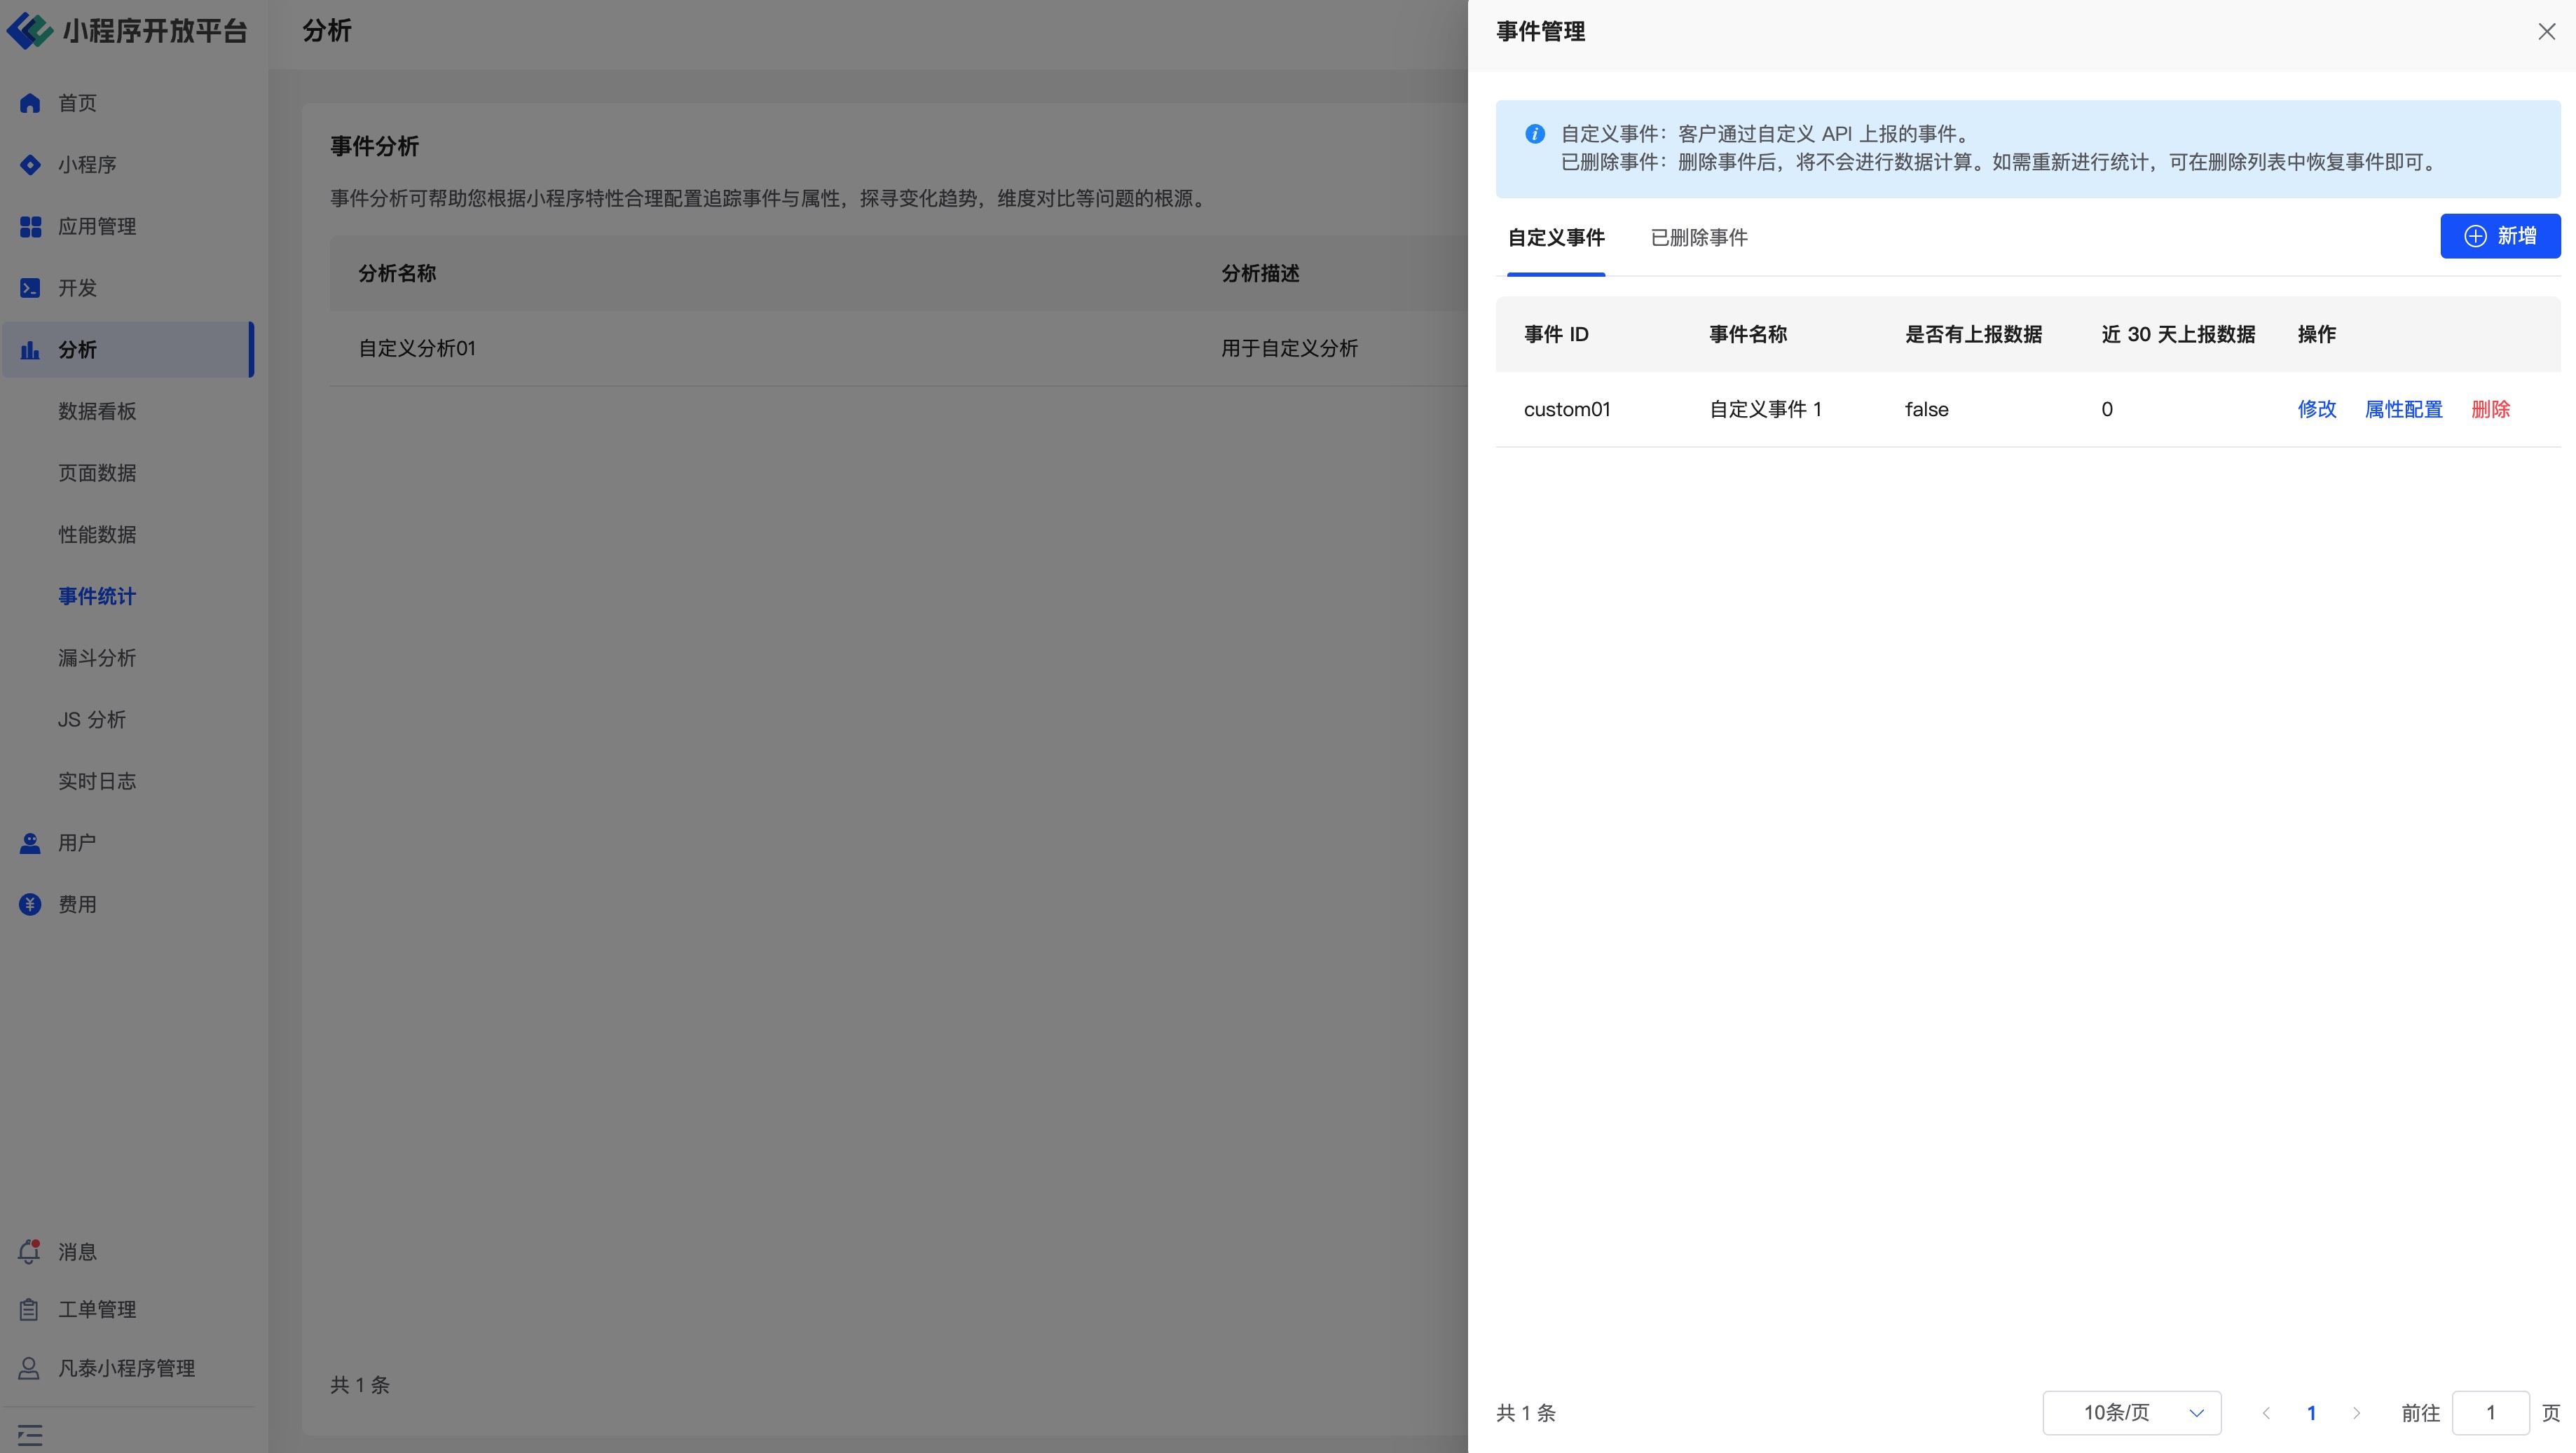
The FinClip Mini-Program statistics feature supports users reporting corresponding events and attributes within the Mini-Program according to their actual business needs, to meet more flexible data statistics requirements. An event can consist of one or more attributes. We need to input the "Attribute ID", "Attribute Name", and "Attribute Type" for each constituent attribute, then input the event and configure the event attributes.
Please Note
- Event IDs that have already been reported or created cannot be modified because the event ID serves as a unique identifier within the event system. If the current event ID does not meet your needs, it is recommended to create a new event ID for data reporting.
- If the association of attributes already linked to a custom event is modified, it will only affect the data statistics function under attribute filtering for that event in Event Analysis. Modify it as needed.
- Attribute names are case-sensitive. If a lowercase attribute already exists, you cannot report an uppercase attribute (e.g., if 'abc' exists, you cannot report 'ABC', 'Abc', etc.). The same attribute must maintain consistent definition and type across different events; otherwise, data validation will fail and the data will not be stored. The type of the attribute value is determined during the first data report. If the type of this attribute value is changed subsequently, a type coercion will be attempted. If successful, the data is stored; if it fails, that piece of data will be discarded.
# 3.5 Funnel Analysis
The Funnel Model is primarily used to analyze the conversion and drop-off at each step of a multi-step process.
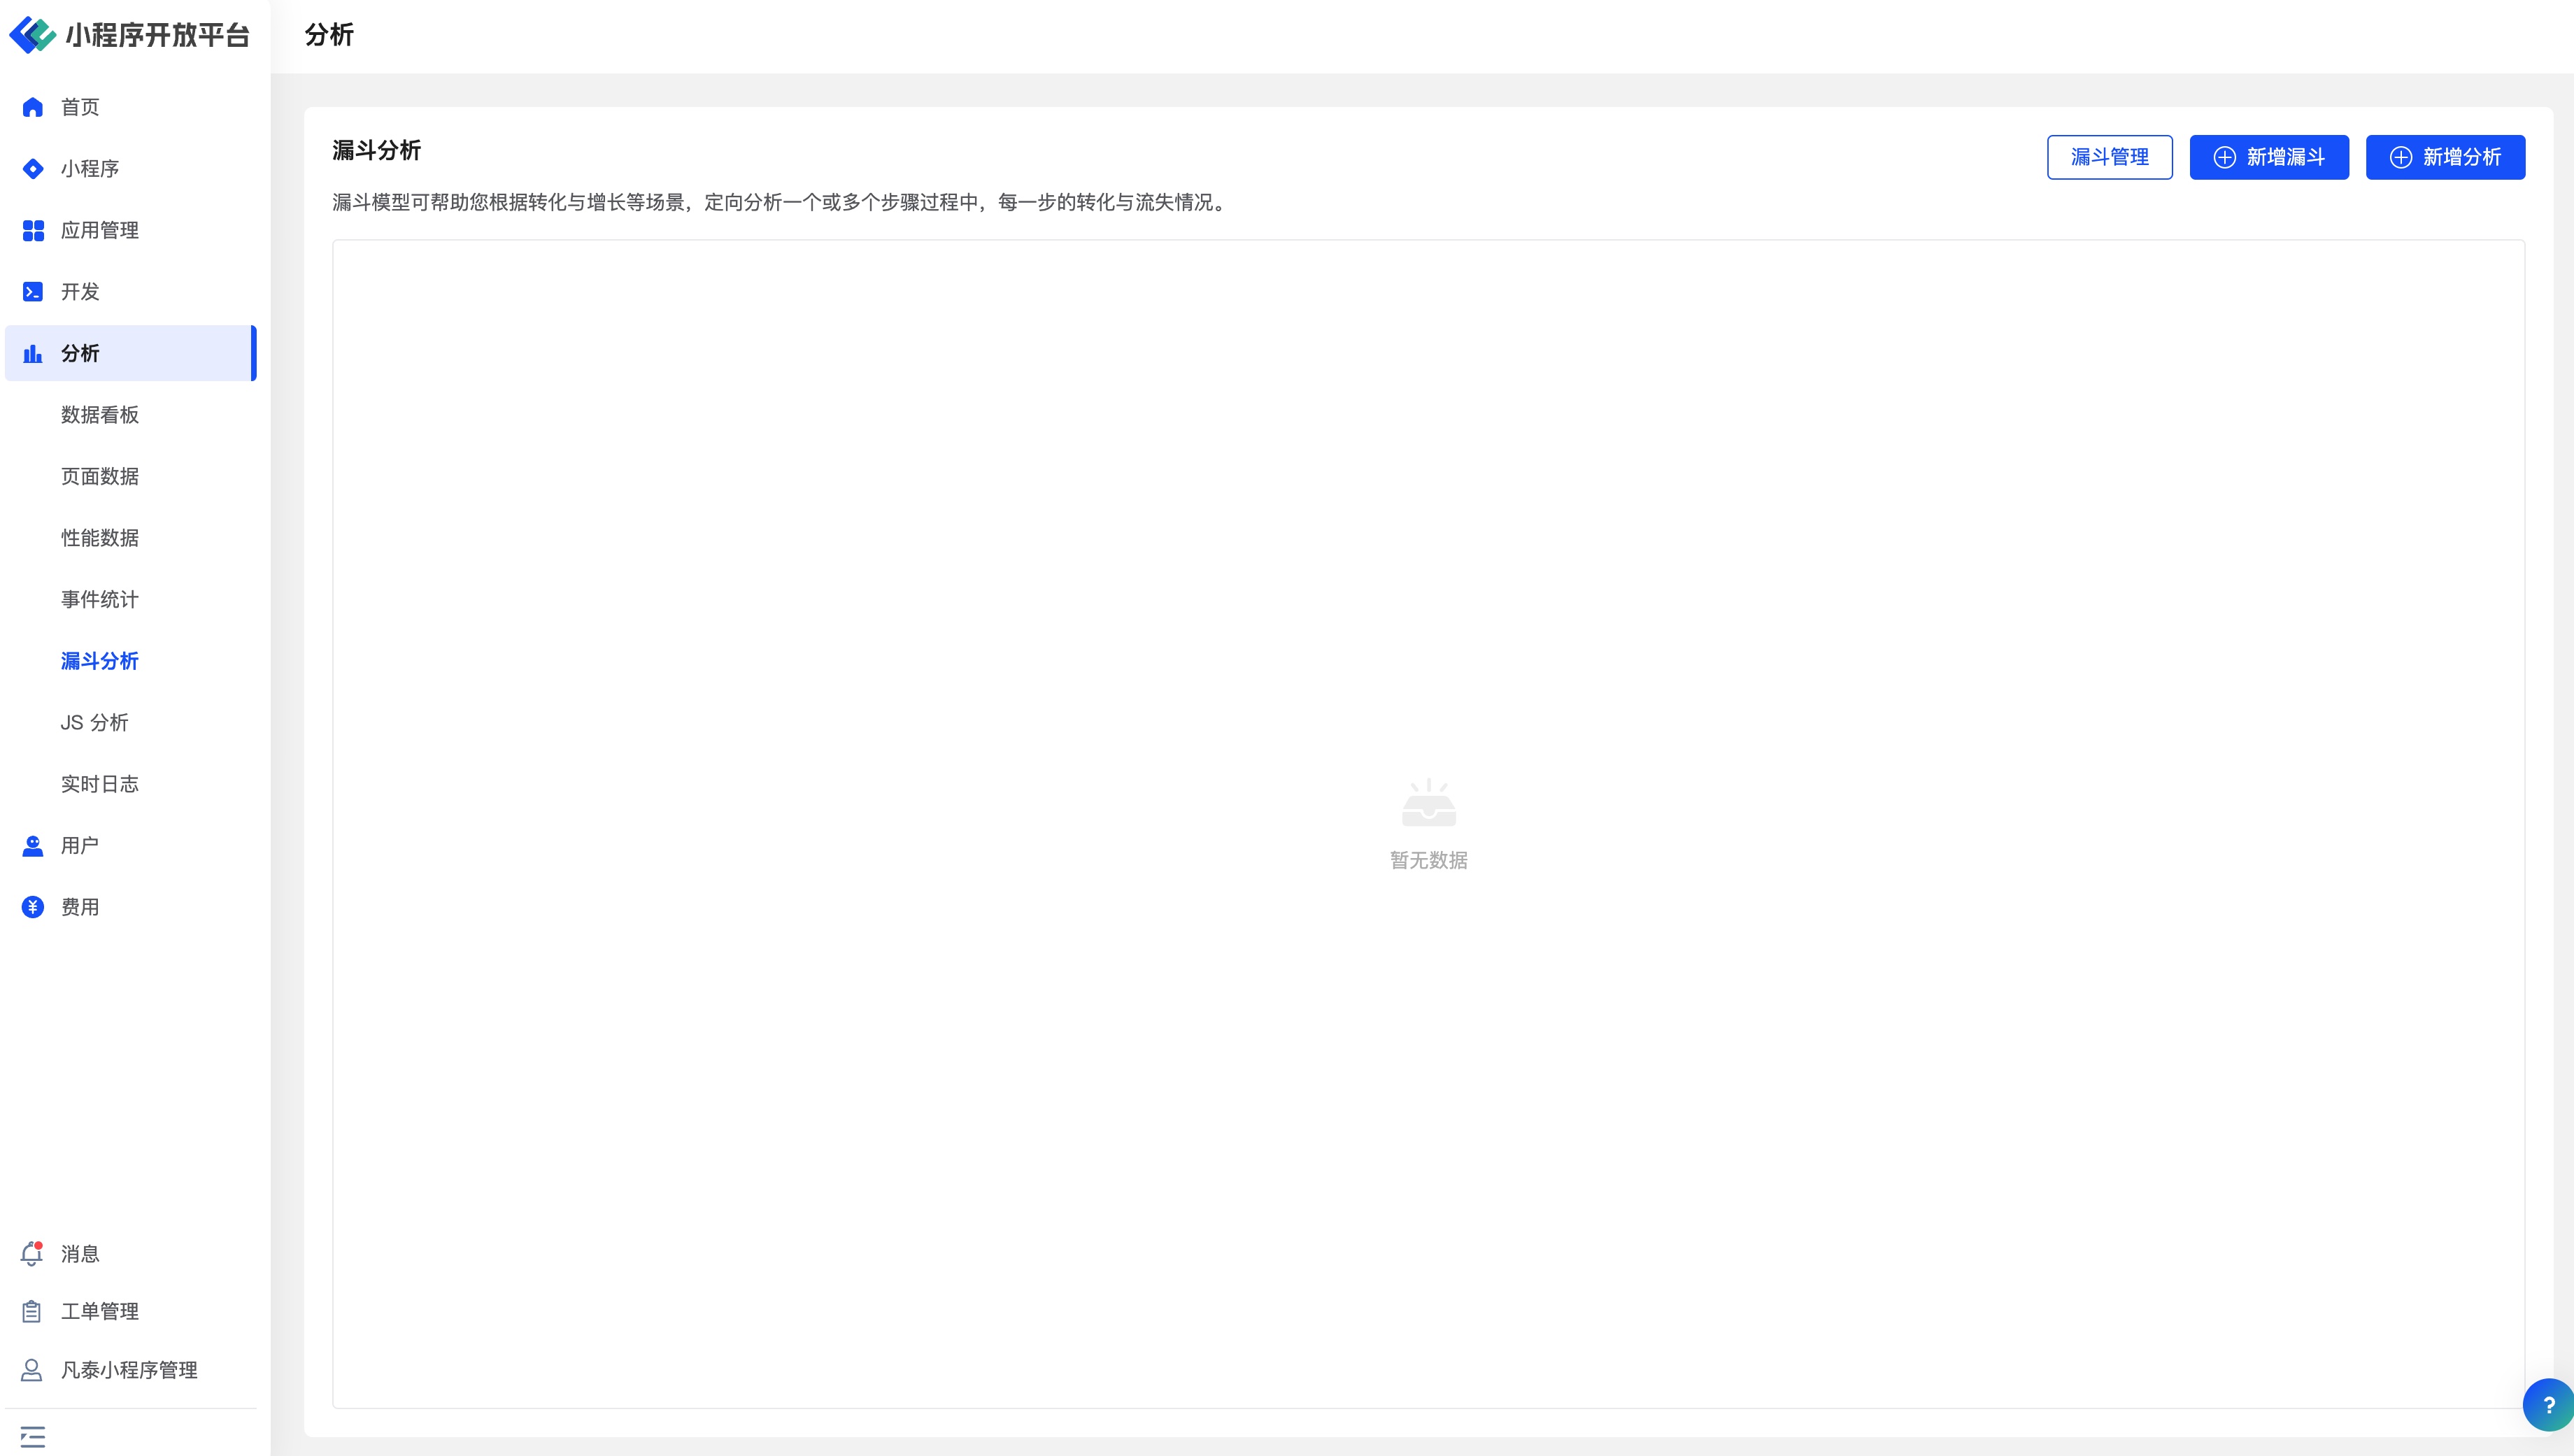
In the Funnel Analysis function, some basic concepts need to be understood first:
- Step: Consists of a Meta Event/Virtual Event plus one or more filter conditions, representing a key step in a conversion process.
- Time Range: The time range selected on the interface refers to the time range during which the first step of the funnel occurs.
- Window Period: The time limit for a user to complete the funnel. Only if a user progresses from the first step to the last step within this time range will it be considered a successful conversion.
The Funnel Model is primarily used to analyze the conversion and drop-off at each step of a multi-step process.
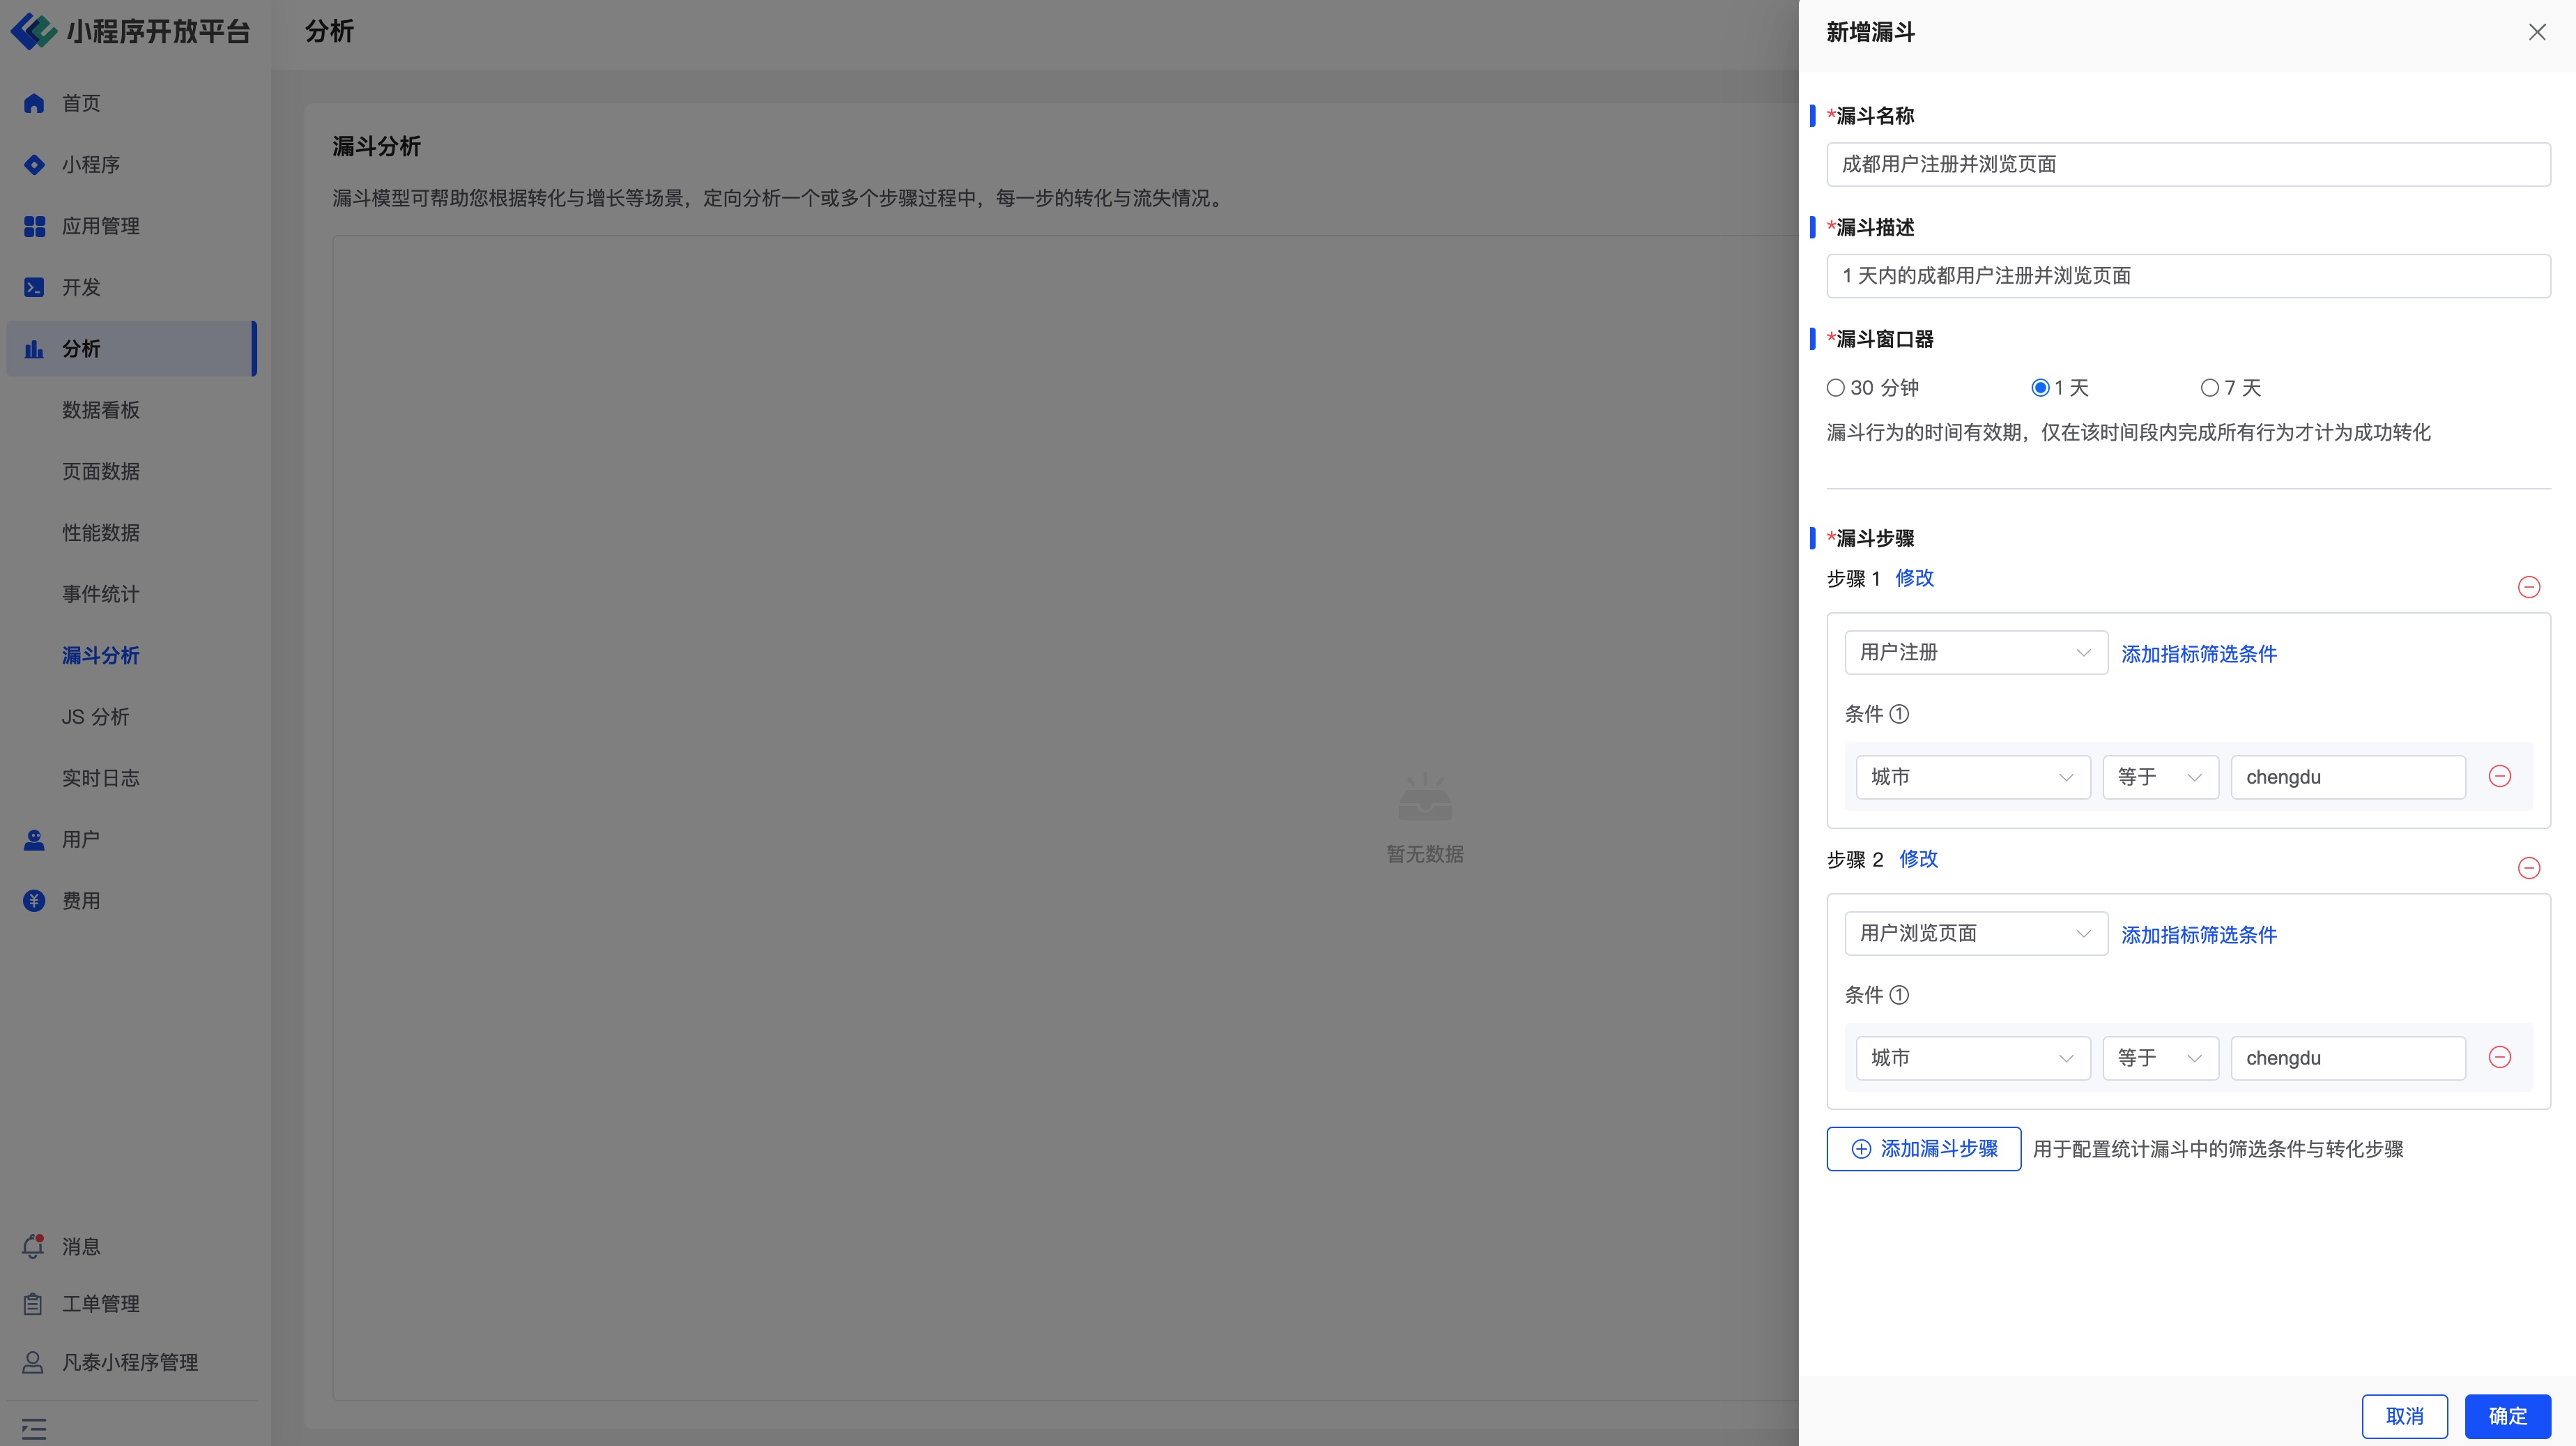
As shown in the figure above, we can configure corresponding events and set up filters to create a statistical funnel for scenarios like "Chengdu users completing registration and browsing a page within 1 day." Then, set the corresponding funnel configuration for analysis.
Determining User Drop-off
Assume a funnel contains five steps: A, B, C, D, E. The selected time range is from January 1, 2023, to January 3, 2023, and the window period is 1 day. If a user triggers step A between January 1, 2023, and January 3, 2023, and within 1 day of step A occurring, sequentially triggers B, C, D, E, then this user is considered to have completed a successful funnel conversion.
During this process, if other steps or behaviors are interspersed, for example, if the user's behavior sequence under the time constraint is A > X > B > X > C > D > X > E (where X represents any event), this user is still considered to have completed a successful funnel conversion.
If the user sequentially triggers A > B > C > E within this time constraint, the user has not completed the funnel conversion and will be recorded as a drop-off user at step C.
# 3.6 JS Analysis
Provides various JS exception errors officially collected, facilitating the identification of error content, timely fault repair, and experience optimization.
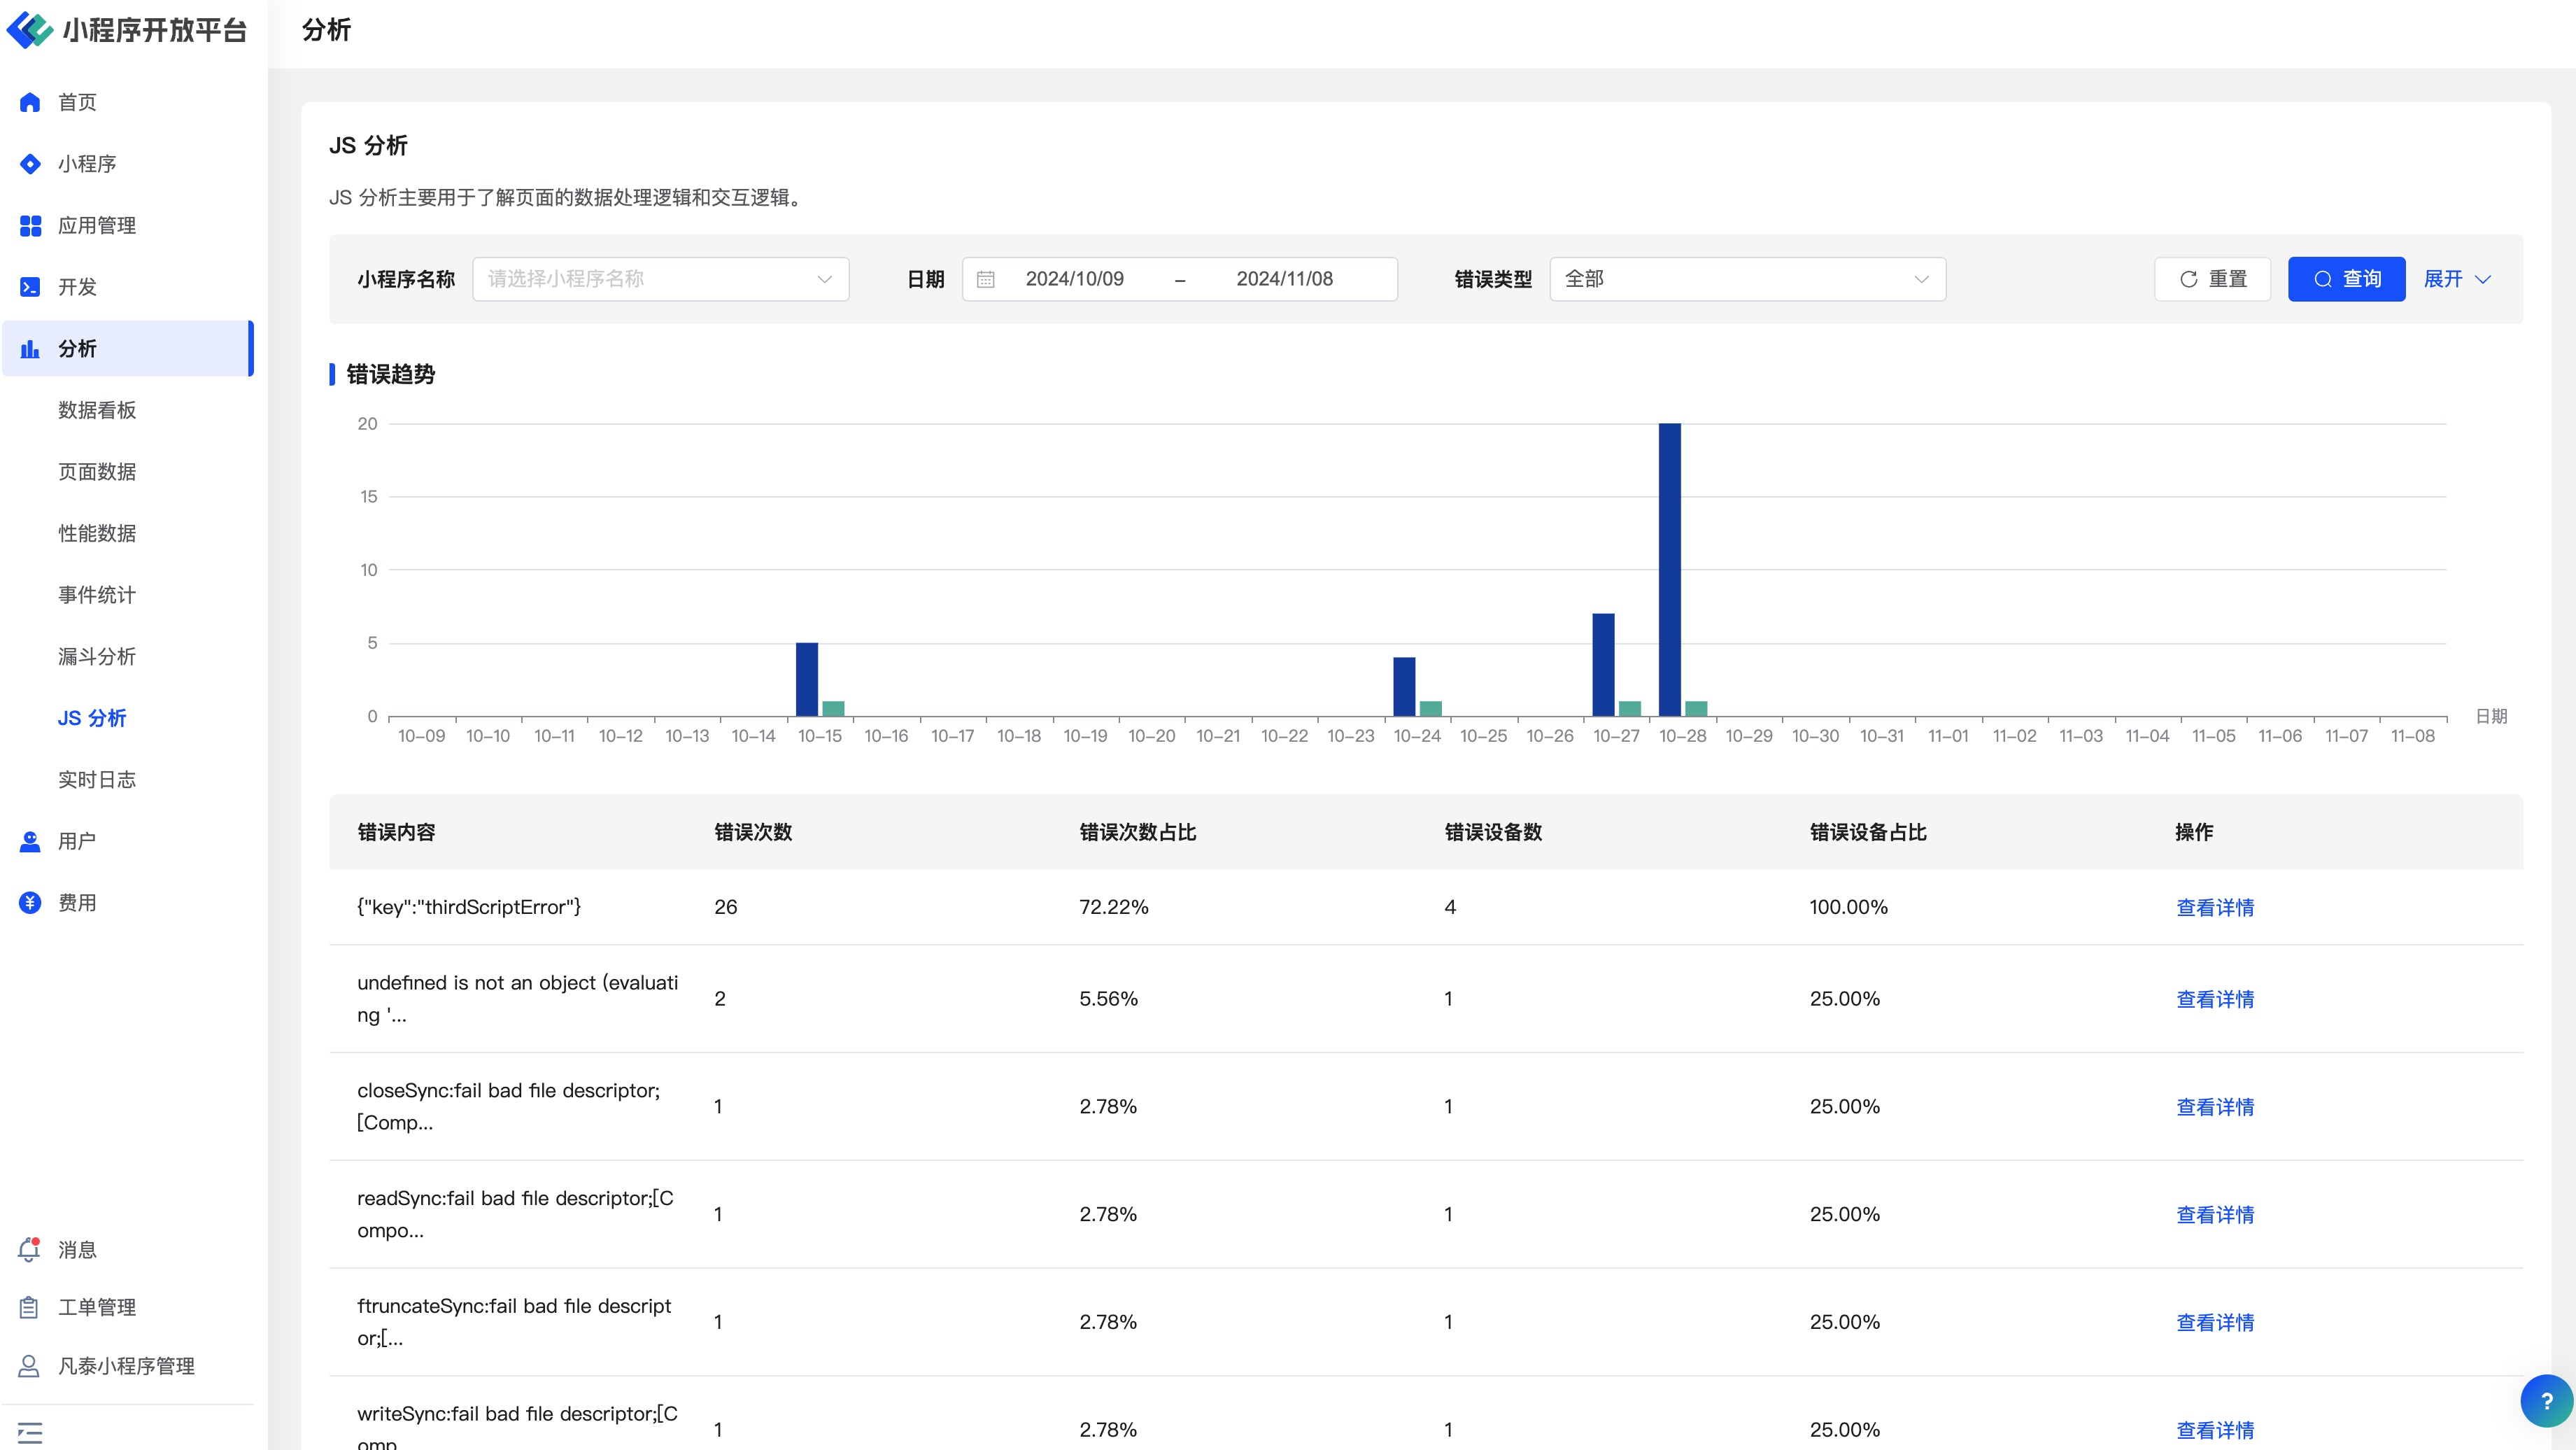
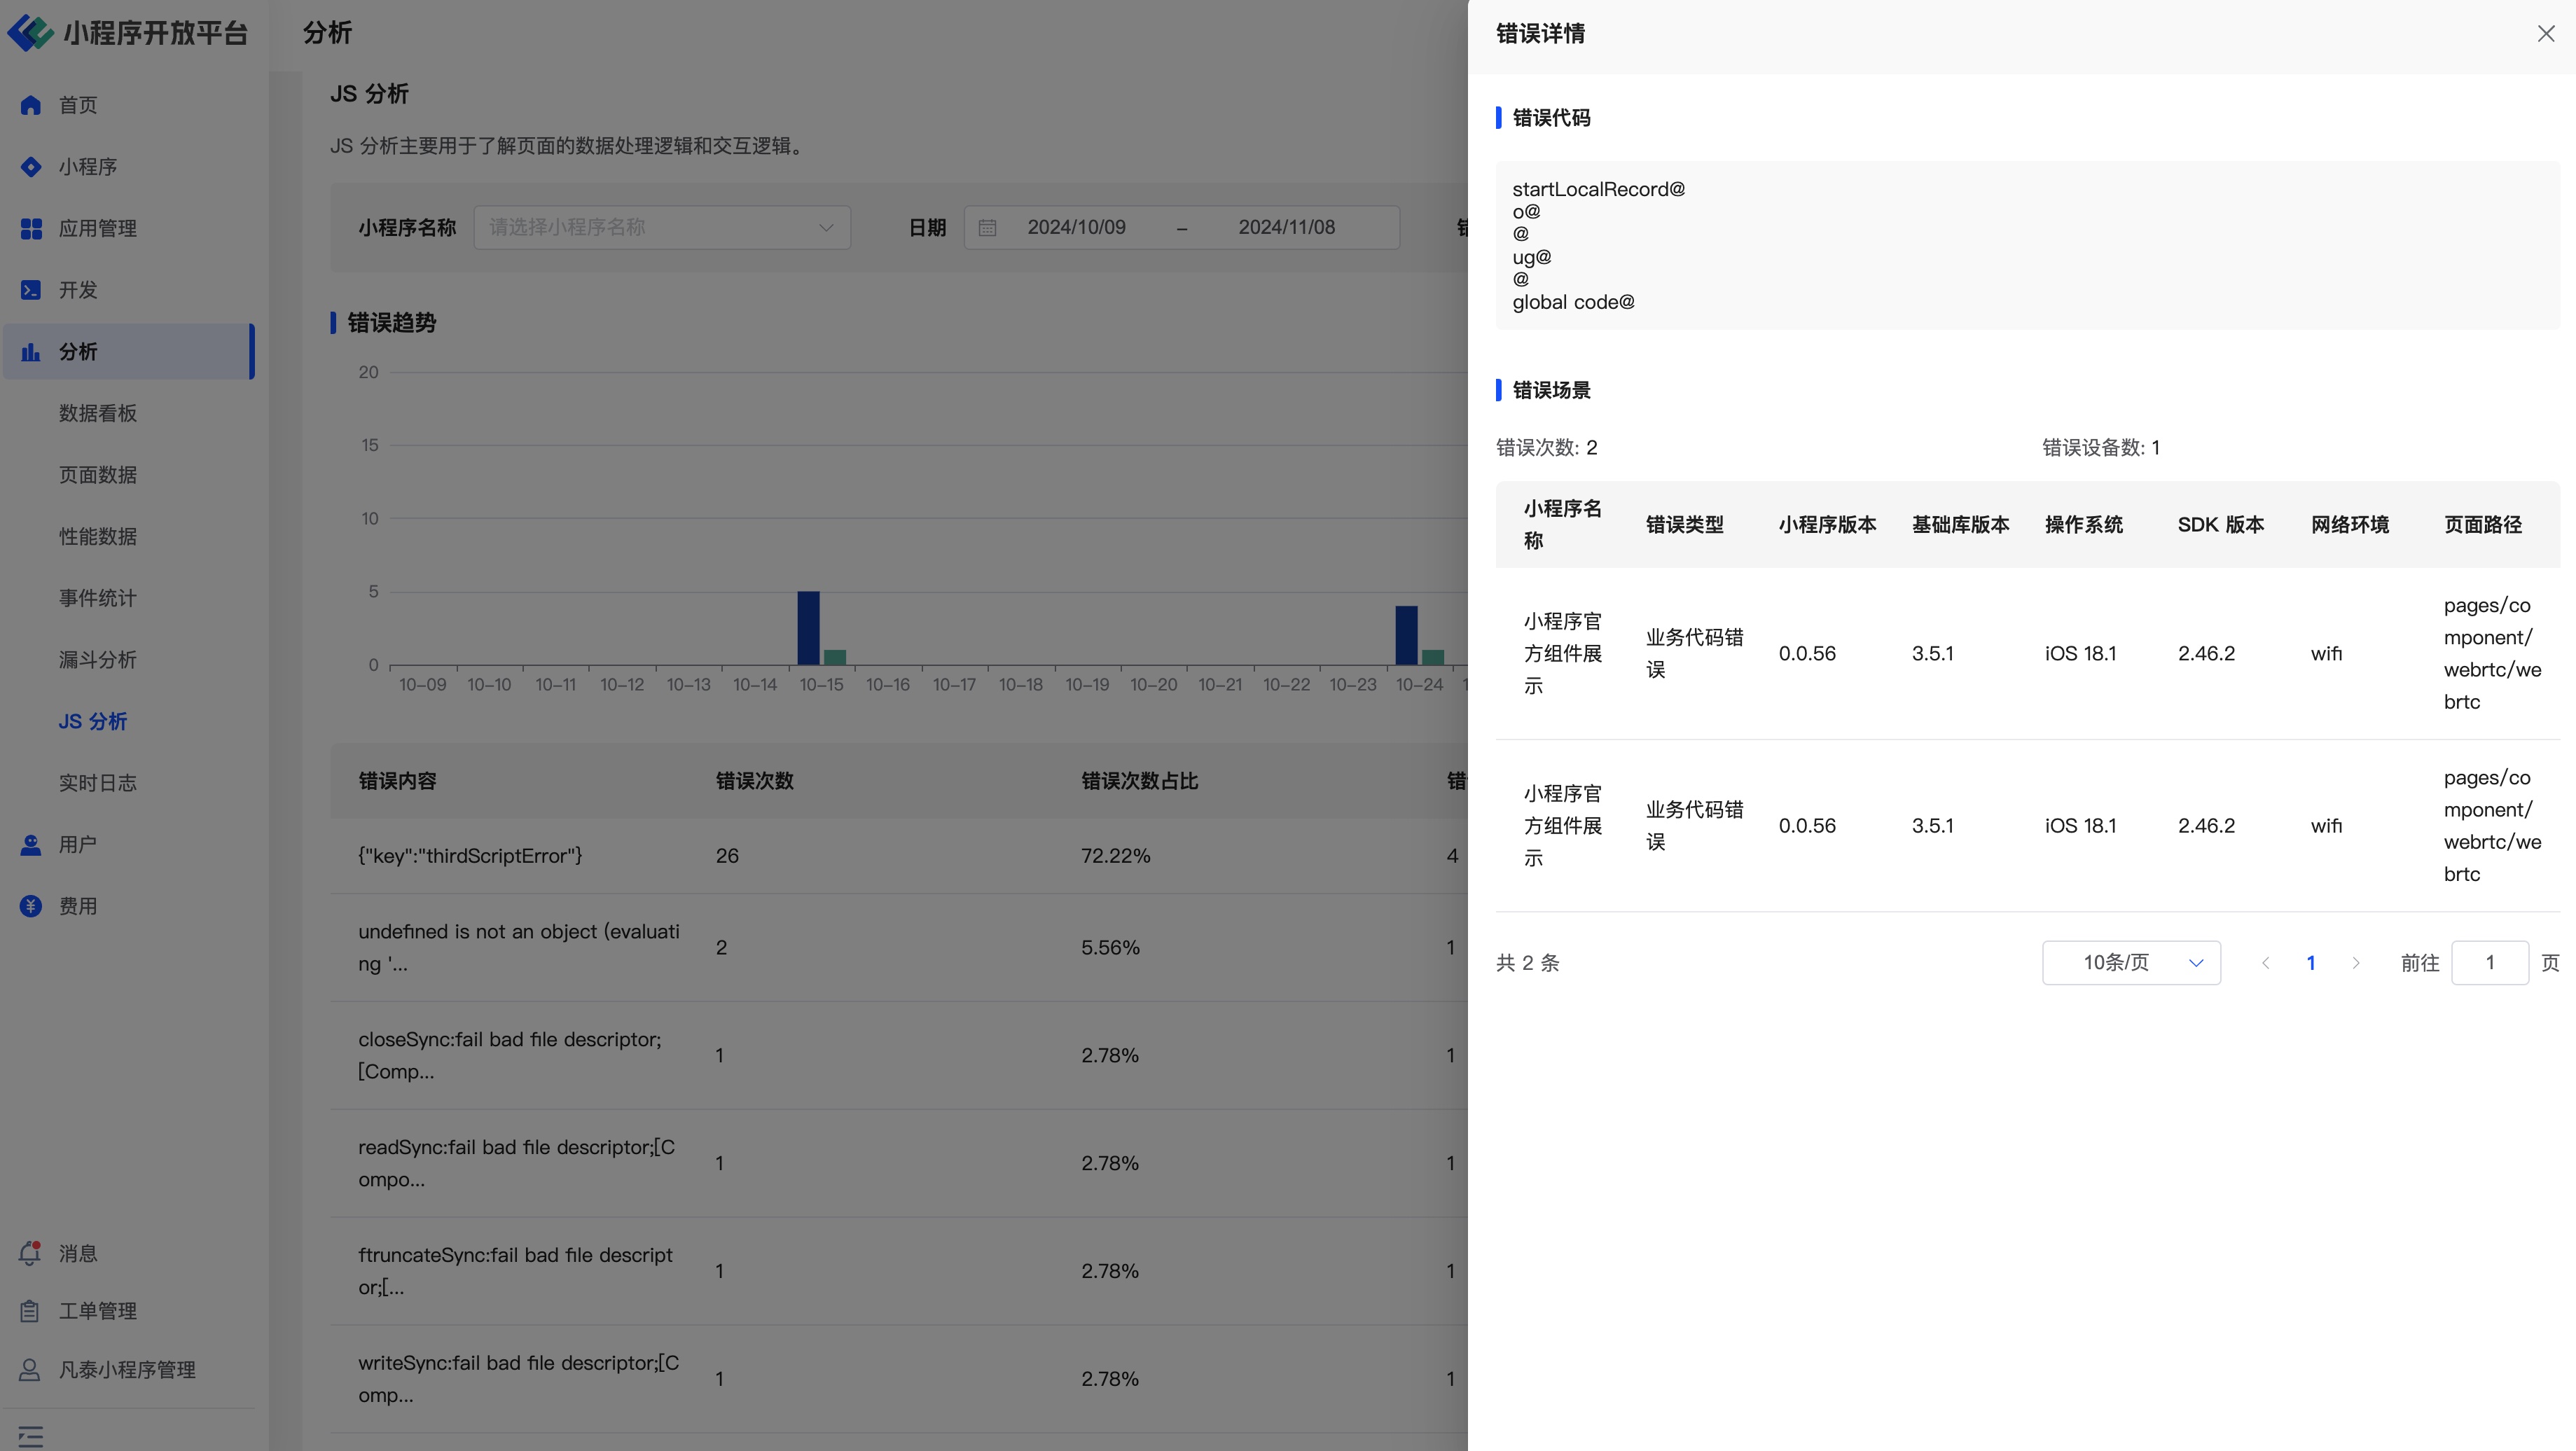
Click the "Details" button on the right side of the page to see detailed error information, error stack traces, and the specific count and user device information captured within the Mini-Program.
# 3.7 Real-time Logs
After logging online, you can view the reported log information in Real-time Logs to efficiently and quickly troubleshoot Mini-Program vulnerabilities and locate issues.
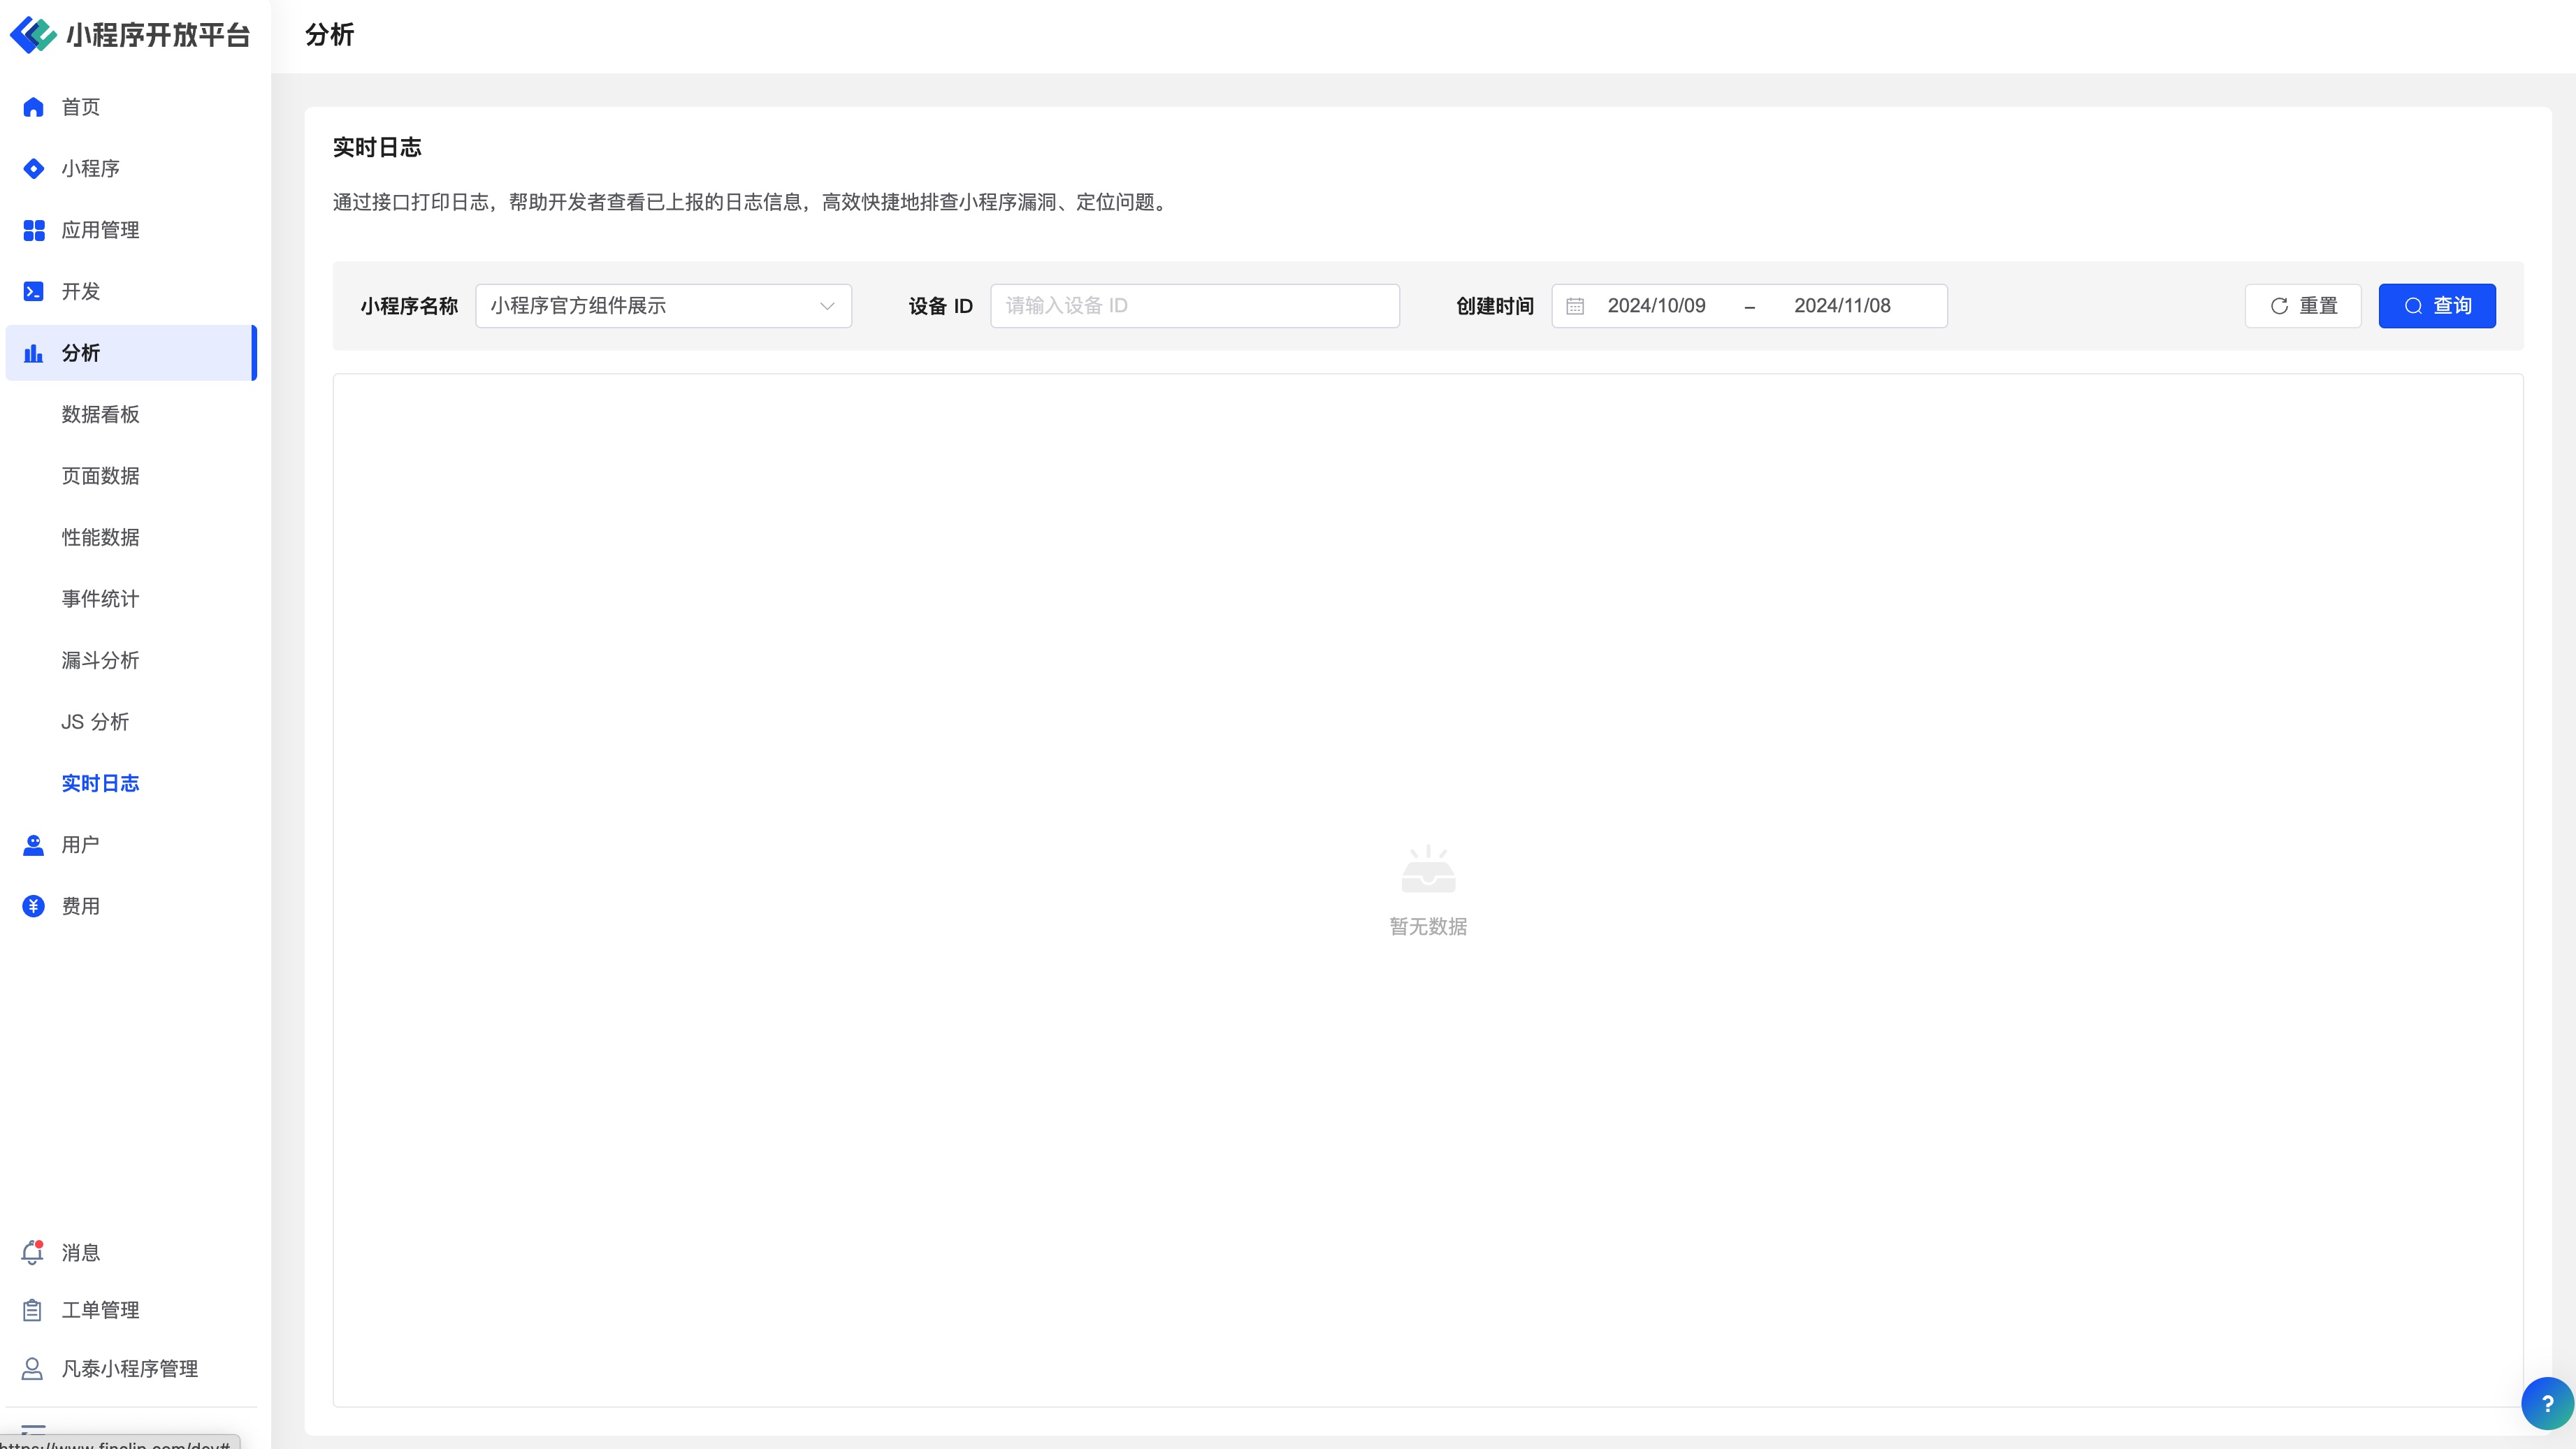
Developers can query log information for specific users by setting filter conditions such as the corresponding Mini-Program, Device ID, and time period.
# 4. Environment Specifications
| Community Edition | SaaS Edition | Enterprise Edition (Annual Payment or One-time Purchase) | |
|---|---|---|---|
| Statistical Analysis | ❌ | ✅ | ✅ |
| Statistical Analysis (Advanced) | ❌ | ✅ | ✅ |