# Feature Introduction (Historical Version)
Please Note
Mini-Program data analysis is a data analysis tool for Mini-Program developers and operators. Conventional analysis is primarily based on the "Data Statistics" module of the Mini-Program Open Platform, providing enterprise-side and operations-side with rich, commonly used data metrics. These metrics are processed visually to help users better track and manage Mini-Program and platform operations.
# 1. Enterprise-Side Visualized Data
Enterprise-side data can be viewed via "Data Statistics". All metrics and their descriptions included in this feature are as follows:
| Data | Description |
|---|---|
| Mini-Program Open Trend | Displays the number of opens for the selected Mini-Program(s) within a specified time period. Open Count: The number of times a Mini-Program is opened. Each click is recorded once. Statistical Time: 00:00 ~ 23:59 of the current day |
| Average Session Duration | Displays the average session duration per open for the selected Mini-Program on the chosen Host-App(s) within a specified time period. Average Session Duration: The average duration (in seconds) of each Mini-Program open session per day across all devices that accessed the Mini-Program. Calculated as Total Session Duration / Open Count. Statistical Time: 00:00 ~ 23:59 of the current day |
| Device Count | Due to system limitations, Android uses the system's unique ID; iOS uses a unique ID automatically generated locally by the Mini-Program SDK on the user's device. |
| New Device Count | A device is considered a new device the first time it opens the specified Mini-Program within a specific Host-App. New Device Count: Displays the number of new devices for the selected Mini-Program on the chosen Host-App(s) within a specified time period. Statistical Time: 00:00 ~ 23:59 of the current day |
| Active Device Count | Within the selected time range, calculates the daily count of unique devices that opened the specified Mini-Program via the specified Host-App(s). Statistical Time: 00:00 ~ 23:59 of the current day |
| Yesterday's New Device Count | Yesterday: 00:00 ~ 23:59 of the previous day |
| Average New Device Count (Last 7 Days) | Last 7 Days: 00:00 ~ 23:59 from day T-8 to T-1, where T is today |
| Mobile OS Distribution | Within the selected time range, statistics on the distribution of mobile operating systems used among devices that accessed the specified Mini-Program via the selected Host-App(s). |
| SDK Version Distribution | Displays the distribution of SDK versions across the entire environment, and the SDK distribution under the current account. |
Please Note
Due to data reporting rule limitations on different platforms, the data you obtain in FinClip may not be real-time. Please be aware.
# 1.1 Mini-Program Data
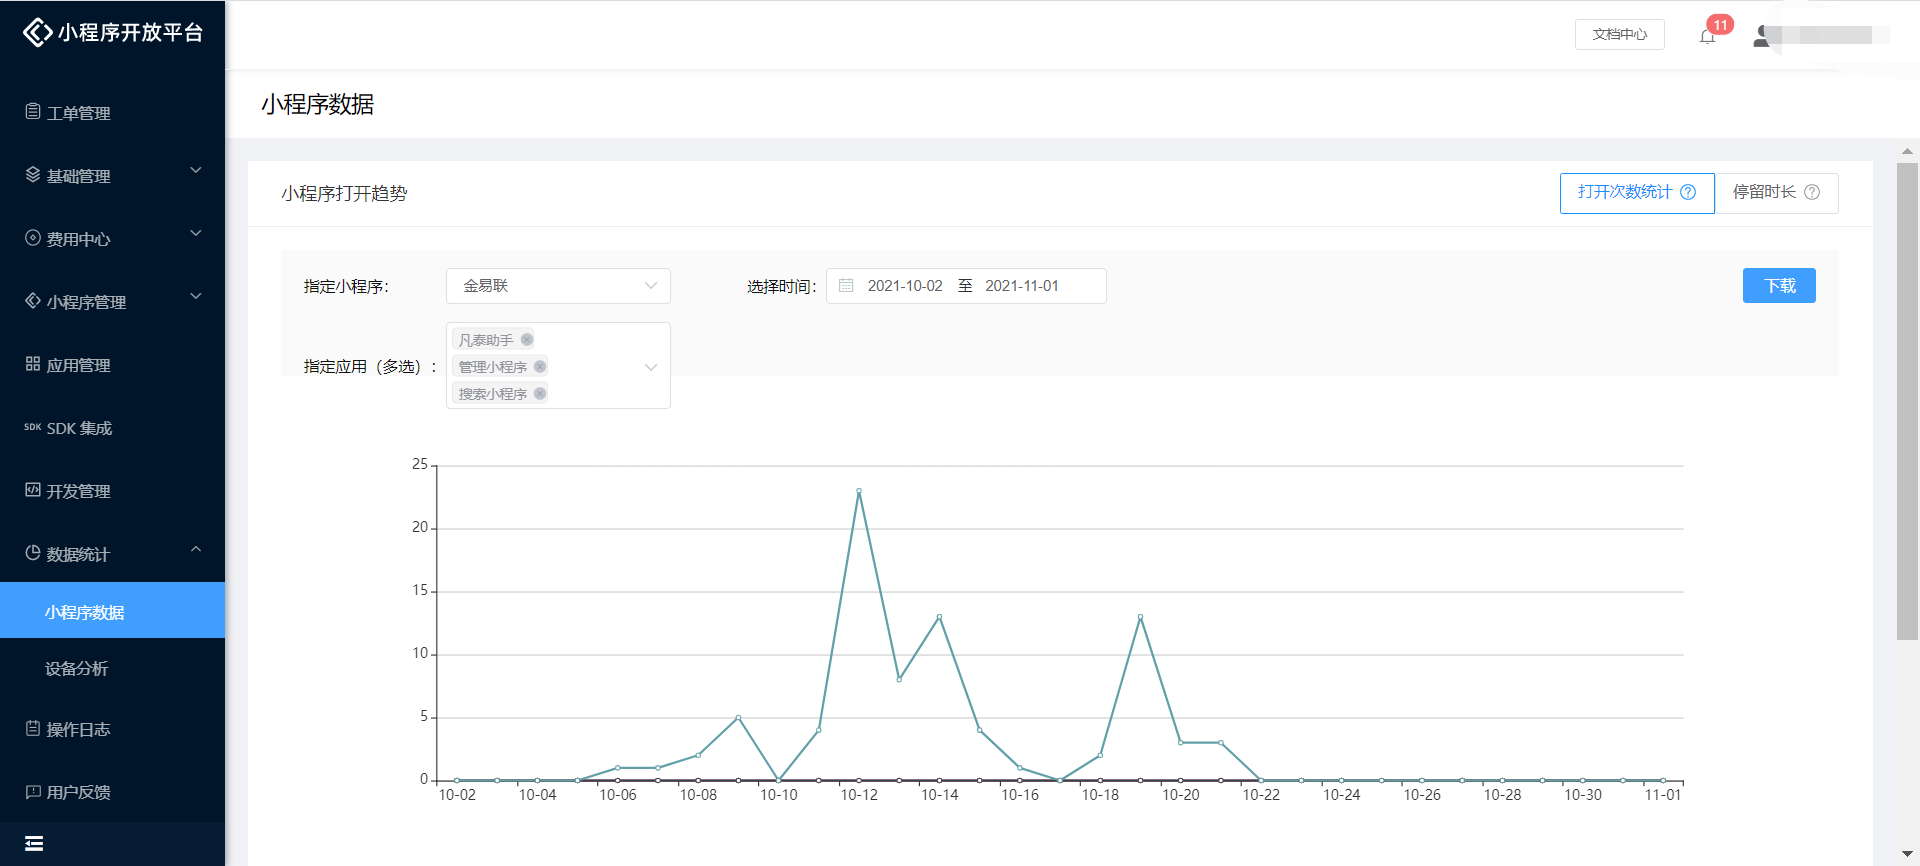
In "Mini-Program Open Trend - Open Count Statistics", the sum of open counts for all Mini-Programs is displayed by default. You can use the "Specify Mini-Program" dropdown to view the open data for a specific Mini-Program. The "Specify Host-App" field supports multiple selections to view open data for the Mini-Program across different associated Host-Apps.
In "Mini-Program Open Trend - Average Session Duration", the average session duration for all Mini-Programs is displayed by default. You can use the "Specify Mini-Program" dropdown to view the session duration for a specific Mini-Program. The "Specify Host-App" field supports multiple selections to view the session duration data for the specified Mini-Program across multiple associated Host-Apps.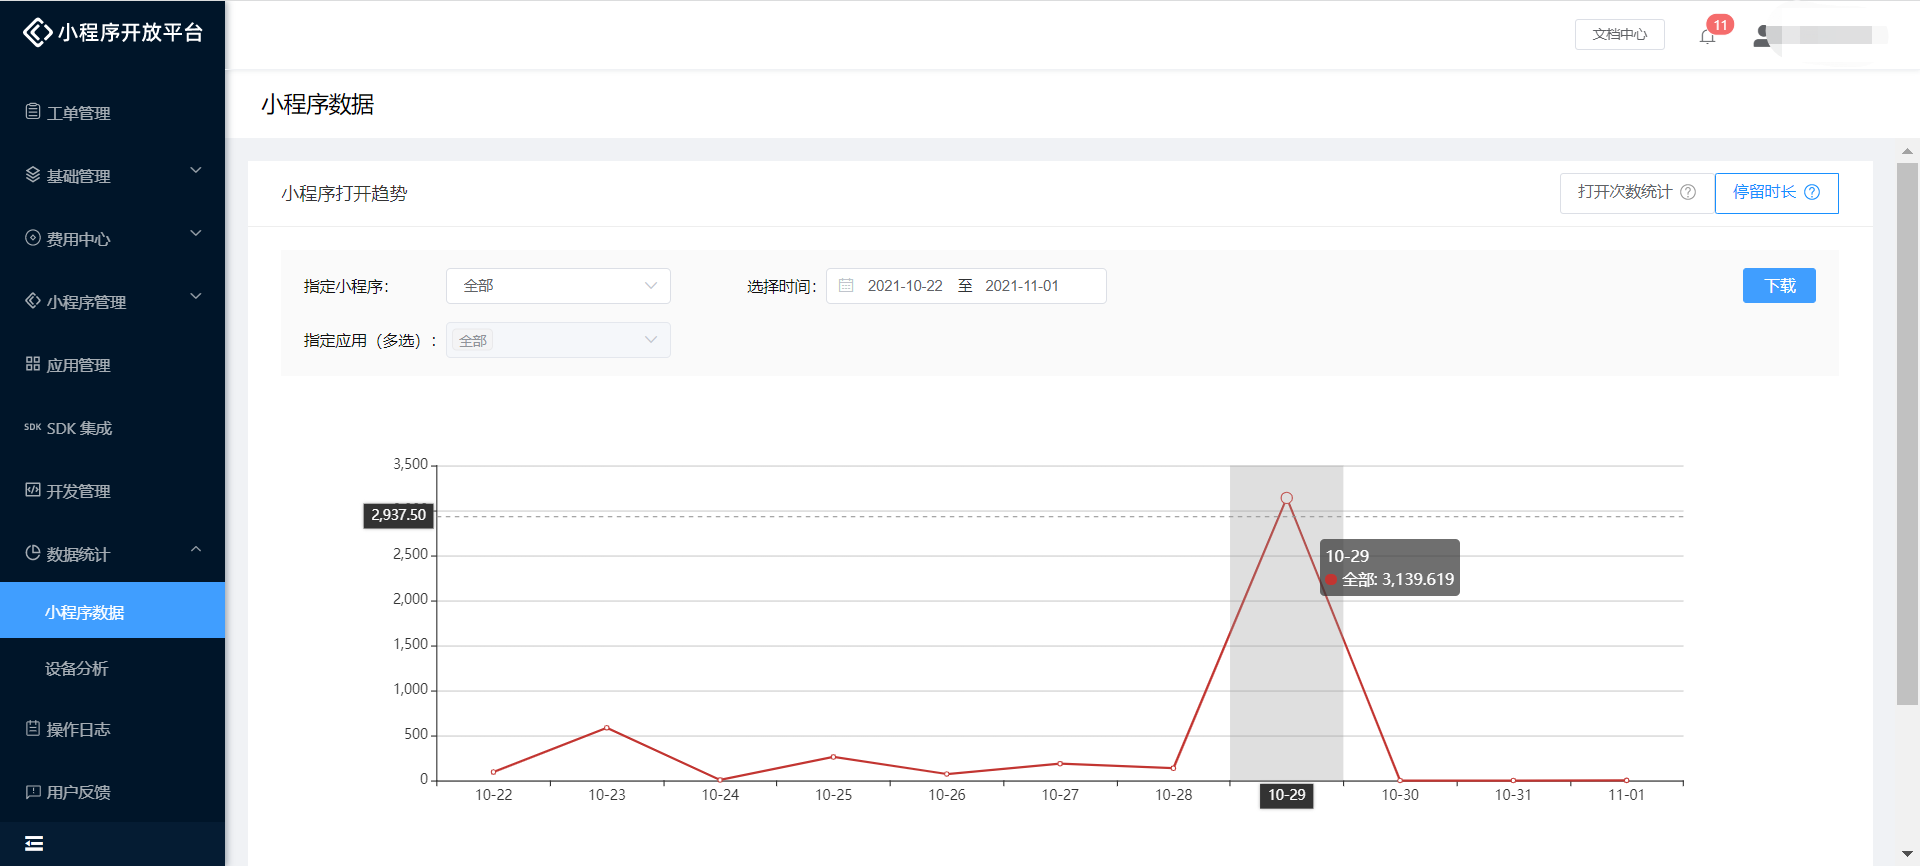
The table below the line chart shows the statistical list of relevant data for the Mini-Program corresponding to the current filter options, including:
- Yesterday's Open Count: 00:00 ~ 23:59 yesterday
- Cumulative Open Count: The total number of opens since the Mini-Program was published.
- Yesterday's Average Session Duration: The average session duration per open for the selected Mini-Program on the chosen Host-App(s) from 00:00 ~ 23:59 yesterday.
- Average Session Duration: The average session duration per open for the selected Mini-Program on the chosen Host-App(s) since publication.

# 1.2 Device Analysis
Device Analysis targets users who use the Mini-Program, helping developers better optimize Mini-Program content.
Due to operating system limitations, Android device statistics use the system's unique ID; iOS uses a unique ID automatically generated locally by the Mini-Program SDK on the user's device.
The cumulative data page in "Device Analysis" is displayed as follows:

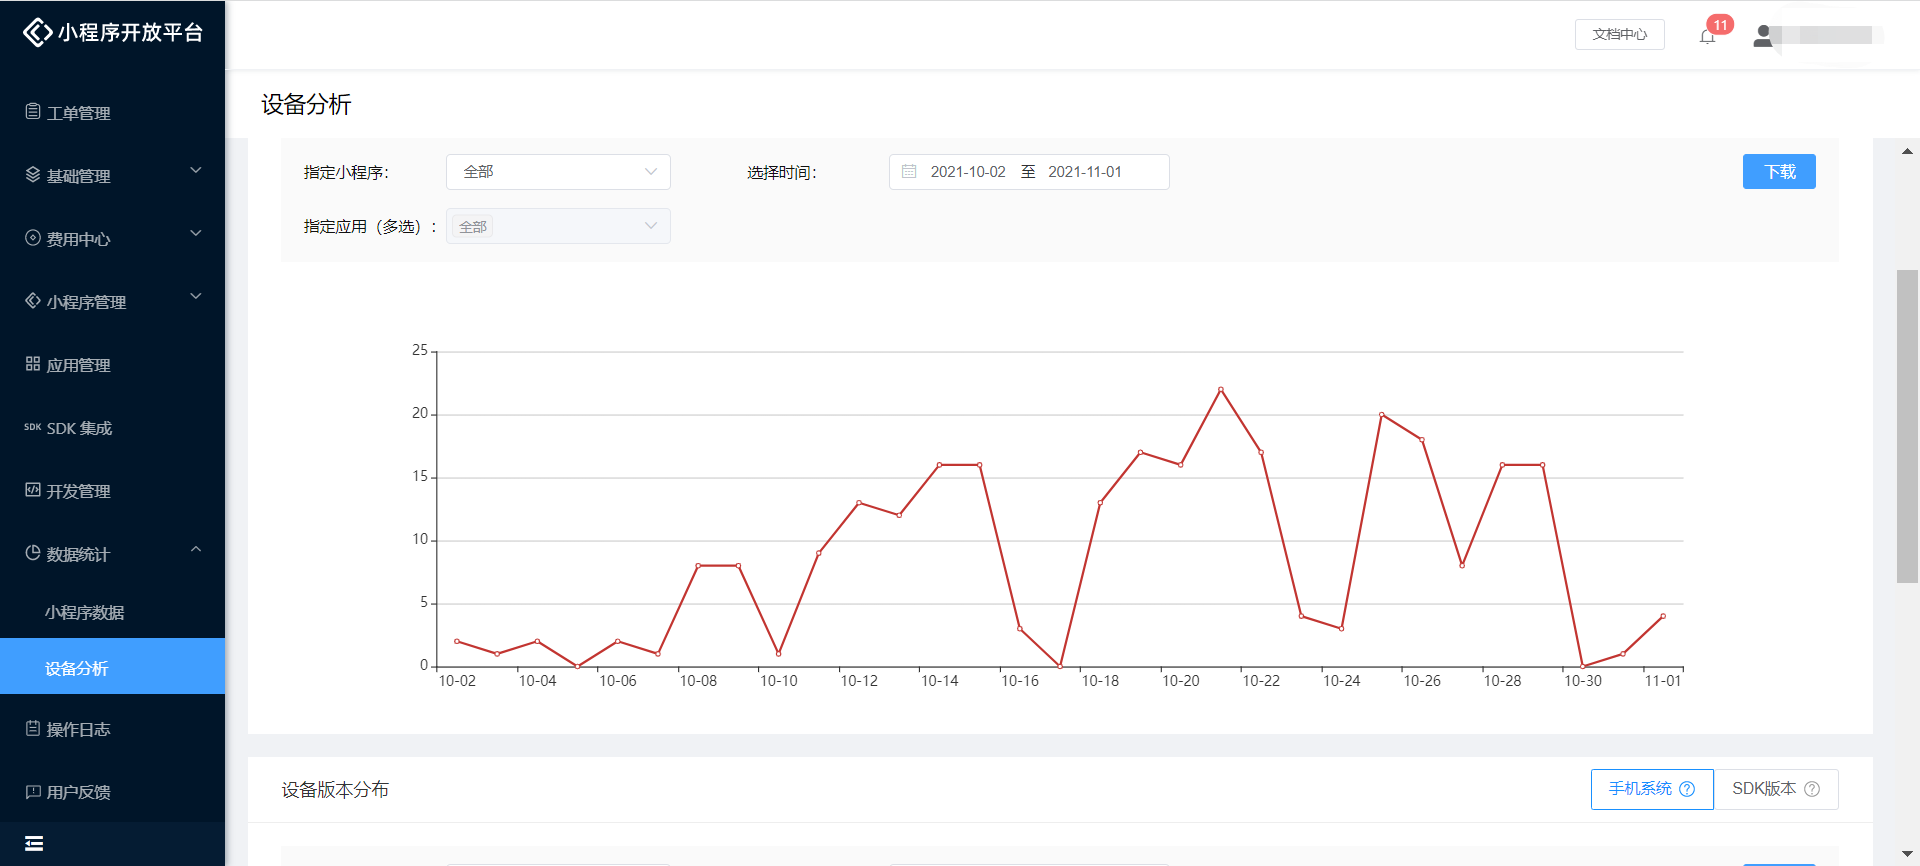
In the "New Device" statistics, the new device trend displays the access situation for new devices across all Mini-Programs by default. Developers can use the top filter box to further specify the Mini-Program, associated Host-App(s), and corresponding time period to view more detailed new device information.
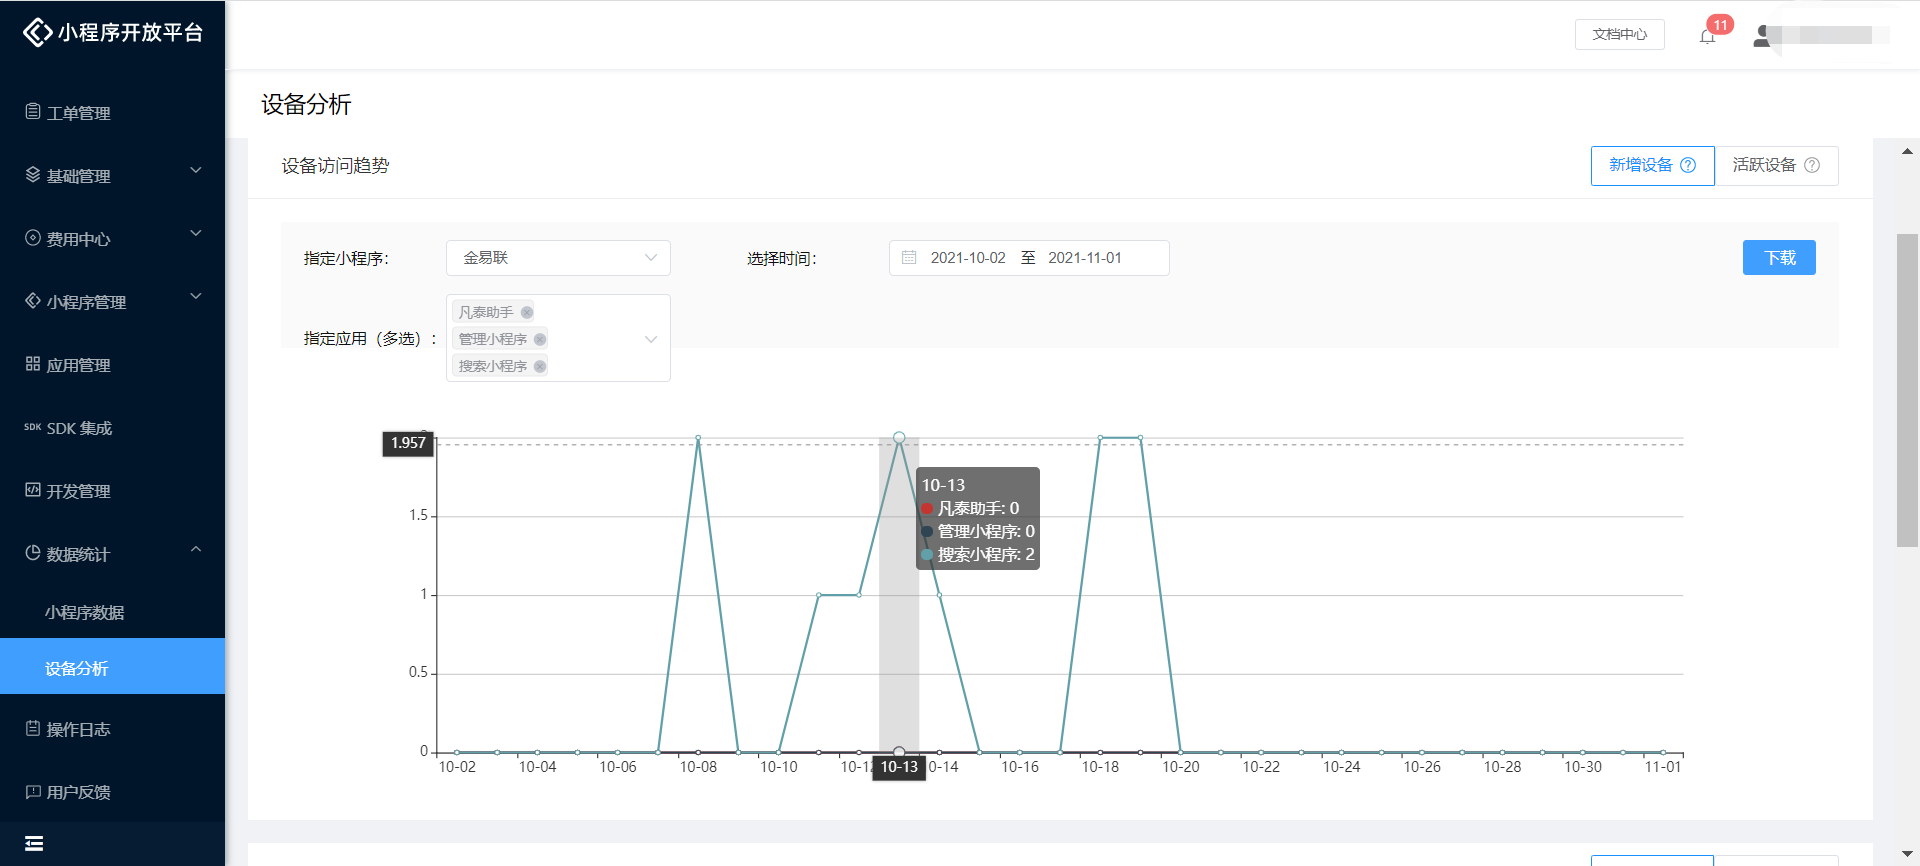
In the "Active Device" statistics, the trend of active devices accessing the Mini-Program can be displayed. By default, it shows the number of active devices for all Mini-Programs. You can use the filter box to specify the Mini-Program, associated Host-App(s), and time period to view more detailed active device access information.
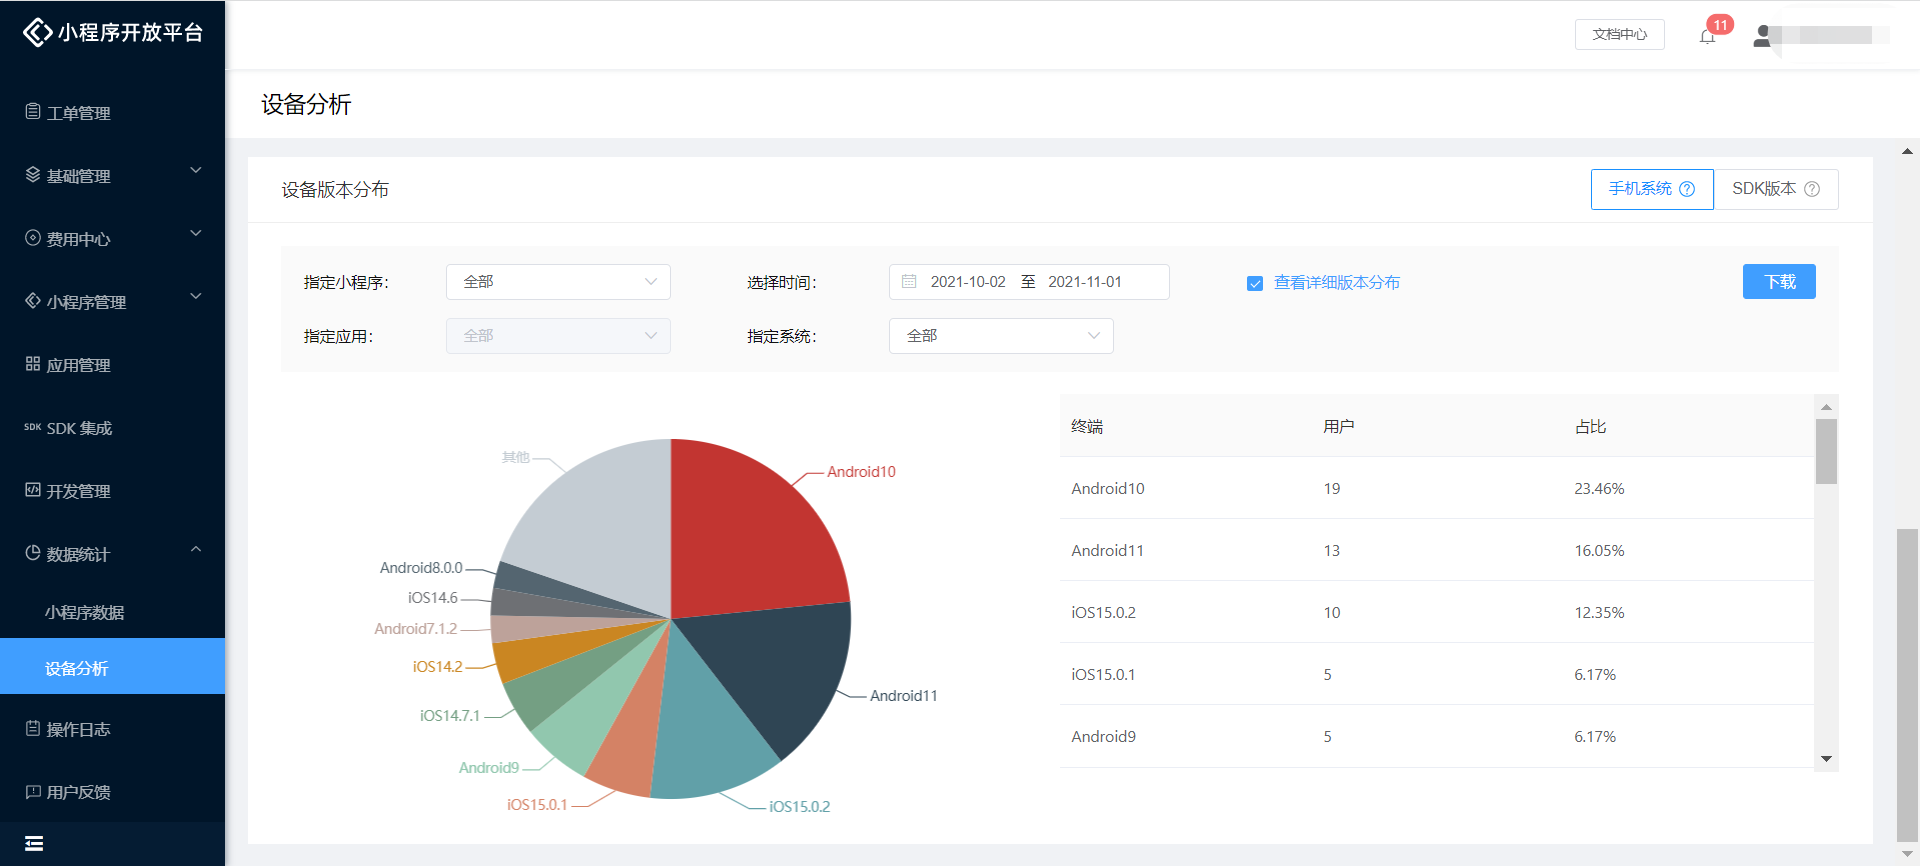
In "Device Version Distribution - Mobile OS":
- By default, it displays the device usage statistics for users opening Mini-Programs within all associated Host-Apps.
- Developers can use the top filter box to further specify the Mini-Program and Host-App to view more detailed device distribution.
- After checking "View Detailed Version Distribution" on the right, specific versions of iOS/Android will be displayed.
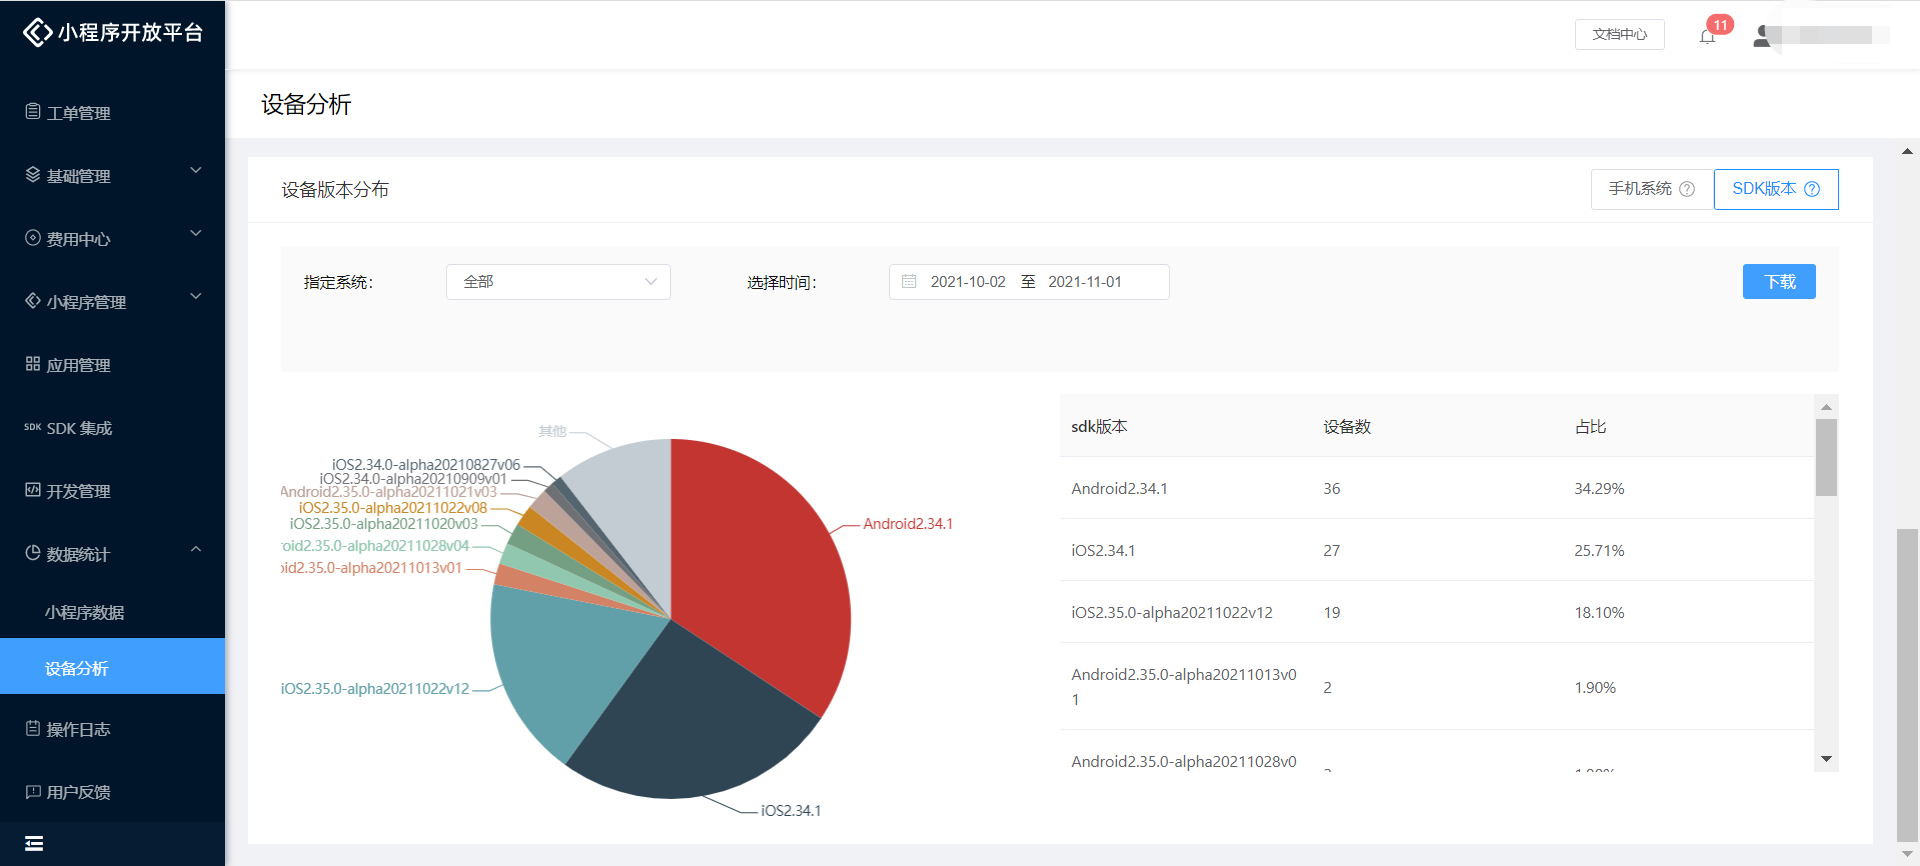
In "Device Version Distribution - SDK":
- By default, it displays the distribution of SDK versions accessing Mini-Programs across the entire environment.
- Developers can use the top filter box to further specify the OS and statistical time.
- After switching the data scope option, you can further specify the OS (Android/iOS) and the device count within the current account.
# 2. Operations-Side Visualized Data
Viewing the "Data Statistics" page on the operations side provides statistics on the current enterprise and Mini-Program access peaks. Based on the results of data reporting, you can understand the open counts and session durations of Mini-Programs and Host-Apps, gaining insight into the overall platform operation status.
# 2.1 Statistical Metrics
| Data | Description |
|---|---|
| Cumulative Certified Enterprises | The total number of enterprises that have submitted certification reviews up until 00:00 today. Includes both approved and rejected certifications. |
| Cumulative Audited Enterprises | The total number of enterprises that have completed the audit process up until 00:00 today. |
| Current Expired Enterprises | The total number of enterprises in the "Expired" status up until 00:00 today. |
| Current Frozen Enterprises | The total number of enterprises in the "Frozen" status up until 00:00 today. |
| Mini-Program Open Trend | Displays the number of opens for the selected Mini-Program(s) within a specified time period. Open Count: The number of times a Mini-Program is opened. Each click is recorded once. Statistical Time: 00:00 ~ 23:59 of the current day |
| Enterprise Open Trend | Displays the number of opens for Mini-Programs published by the corresponding enterprise within a specified time period. Statistical logic is the same as above. |
| Host-App Open Trend | Displays the number of opens for Mini-Programs that are associated with and published within the corresponding Host-App, within a specified time period. Statistical logic is the same as above. |
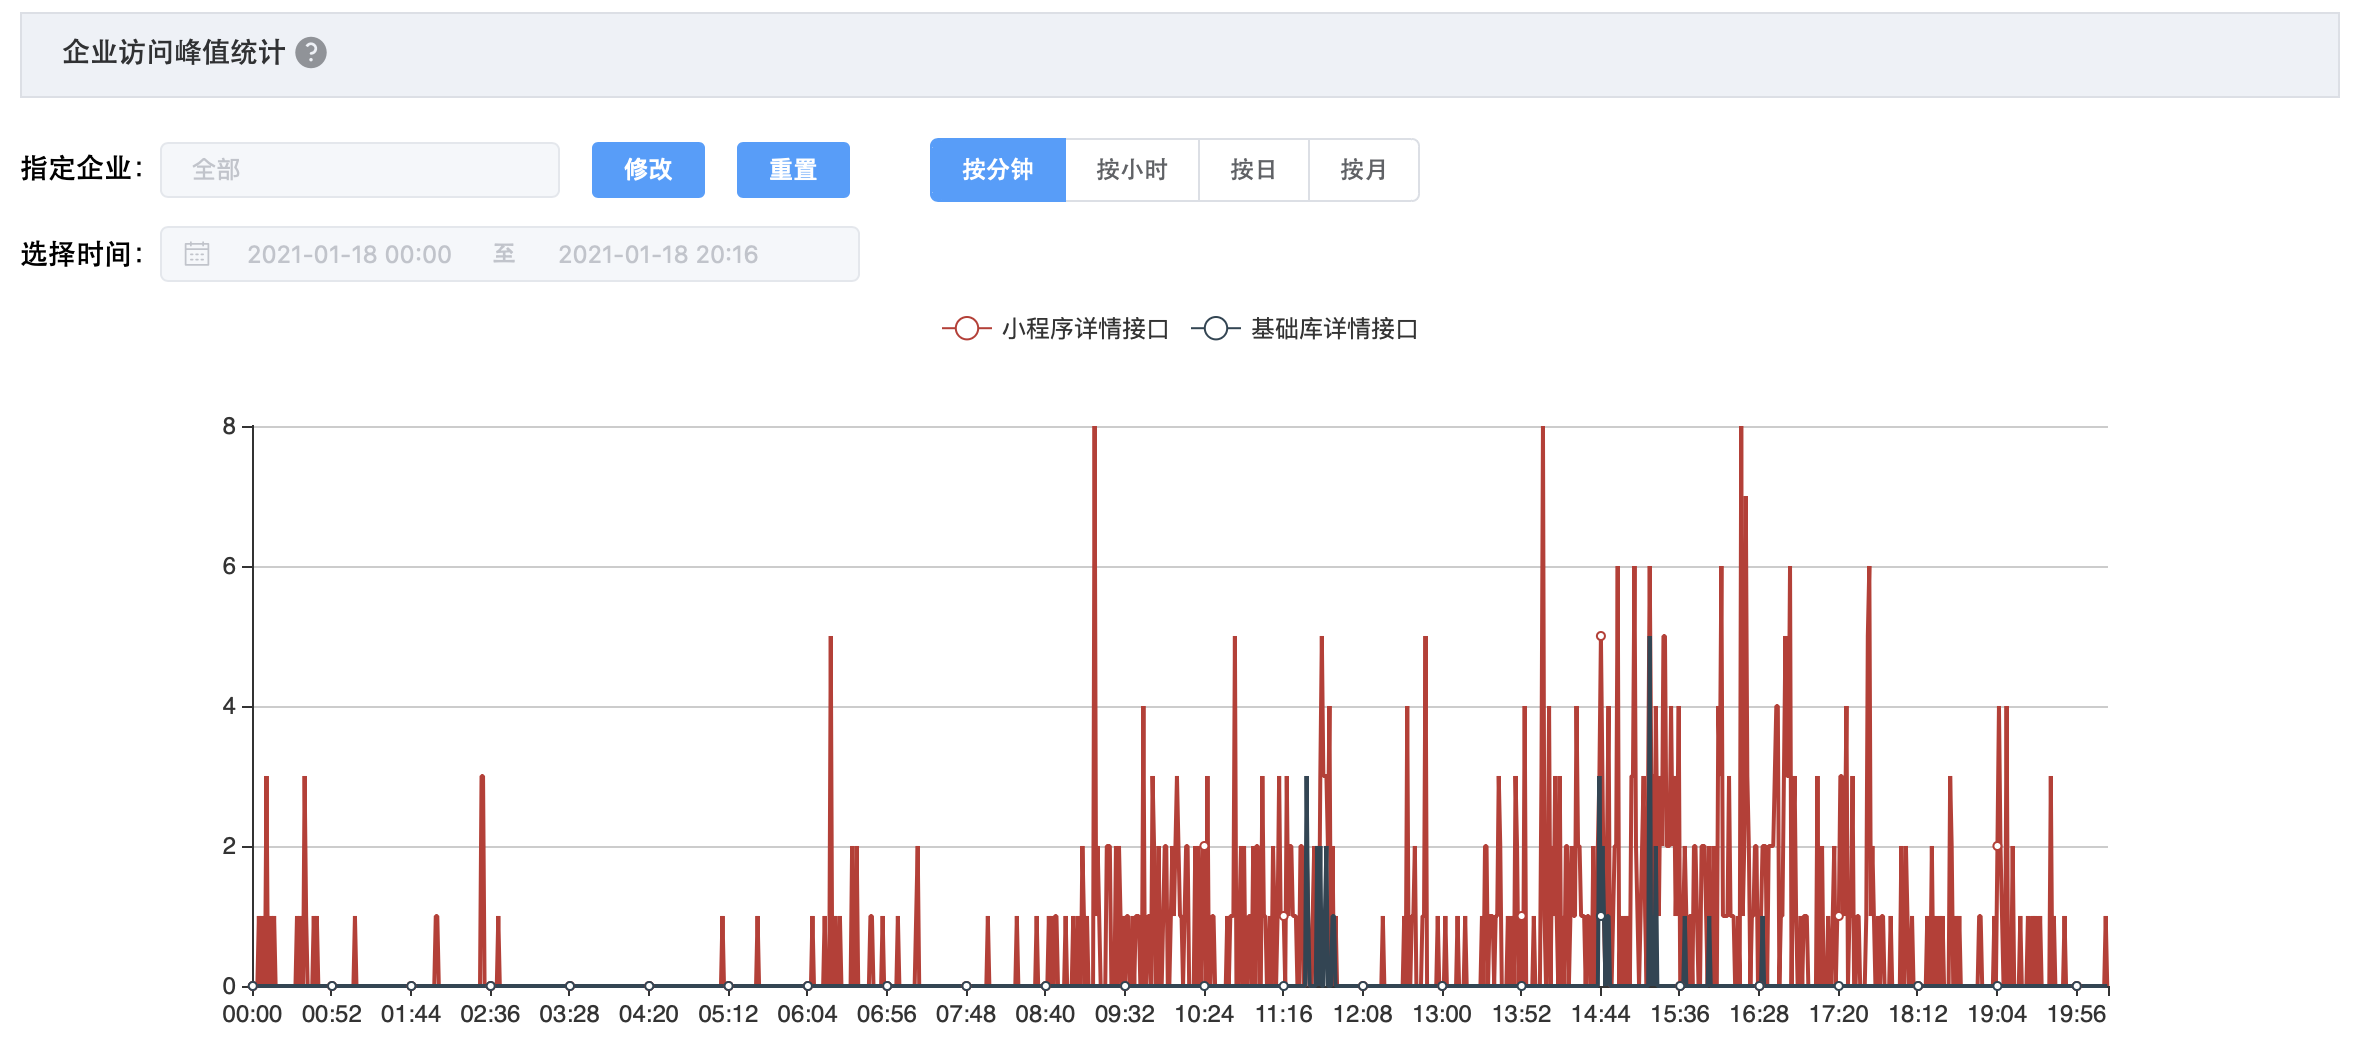
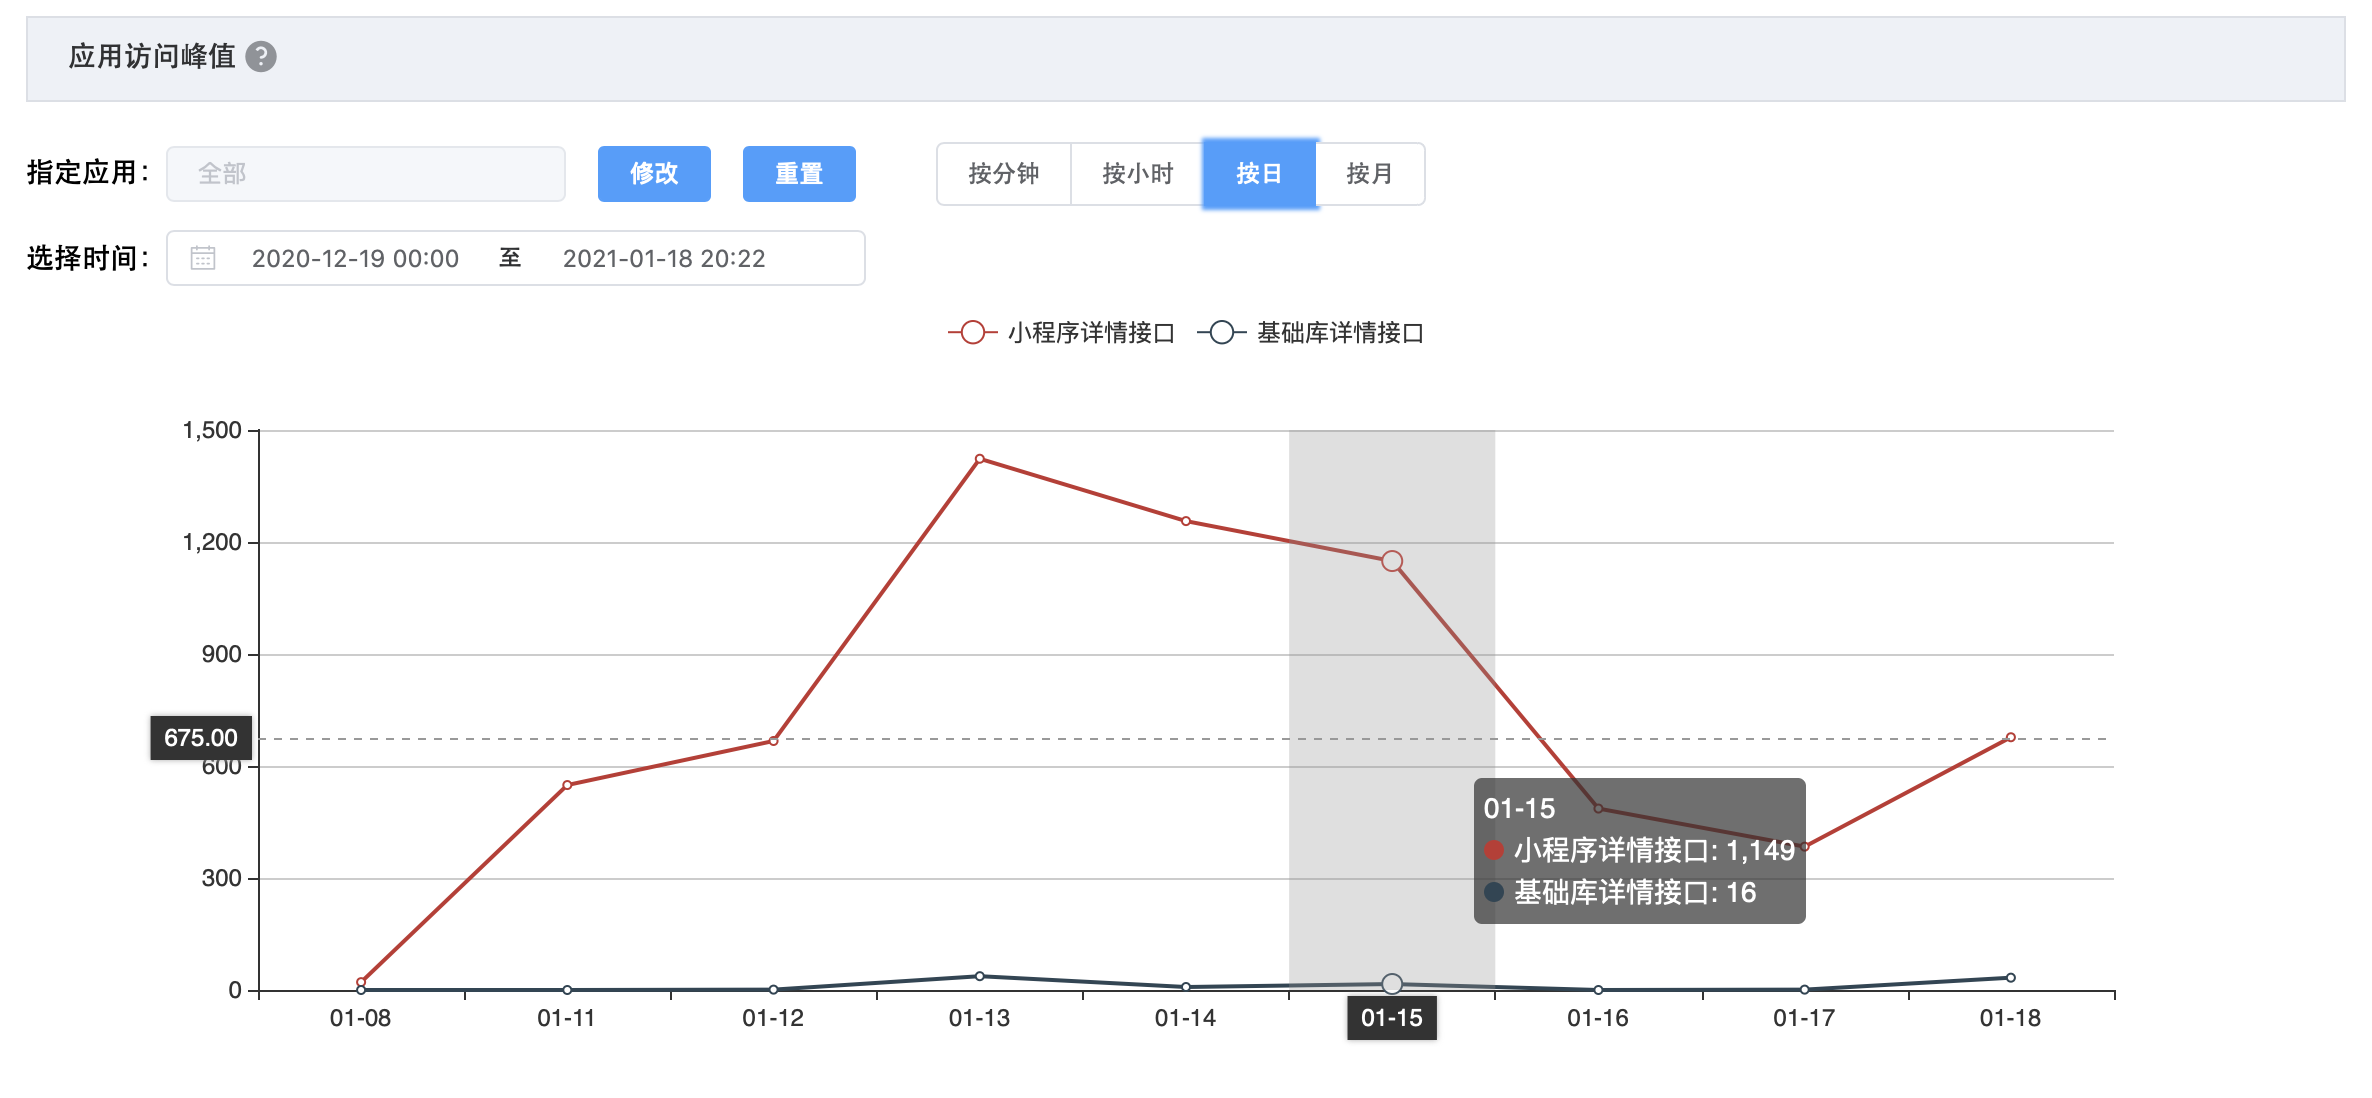
| Enterprise Access Peak Statistics | Displays the queries per second (QPS) for all interface requests issued by all Host-Apps associated within the specified enterprise account. Supported interfaces: Mini-Program details interface, Base Library details interface. Additionally, this chart supports selection by the following dimensions: 【Minute】:Sums the QPS within 00~59 seconds, which is the smallest calculation granularity. 【Hour】:Taking 12:00-12:59 as an example, the calculation method is the sum of QPS from 12:00:00 ~ 12:59:59. 【Daily】:The calculation method is the sum of QPS from 00:00:00 ~ 23:59:59. 【Monthly】:Uses the calendar month as the calculation cycle, summing the daily QPS for that month. |
| Host-App Access Peak Statistics | Displays the queries per second (QPS) for interface requests issued by the specified Host-App. Supported interfaces and dimensions are the same as above. |
# 2.2 Enterprise Data
The cumulative data page in "Enterprise Data" is displayed as follows:

In "Enterprise Access Peak Statistics", you can filter for a specific enterprise, and the data can be displayed according to different time dimensions, as shown below:
In "Host-App Access Peak Statistics", you can filter for the QPS value of a specific Host-App created by a specified enterprise. The data can also be displayed according to different time dimensions, as shown below:
# 2.3 Mini-Program Data
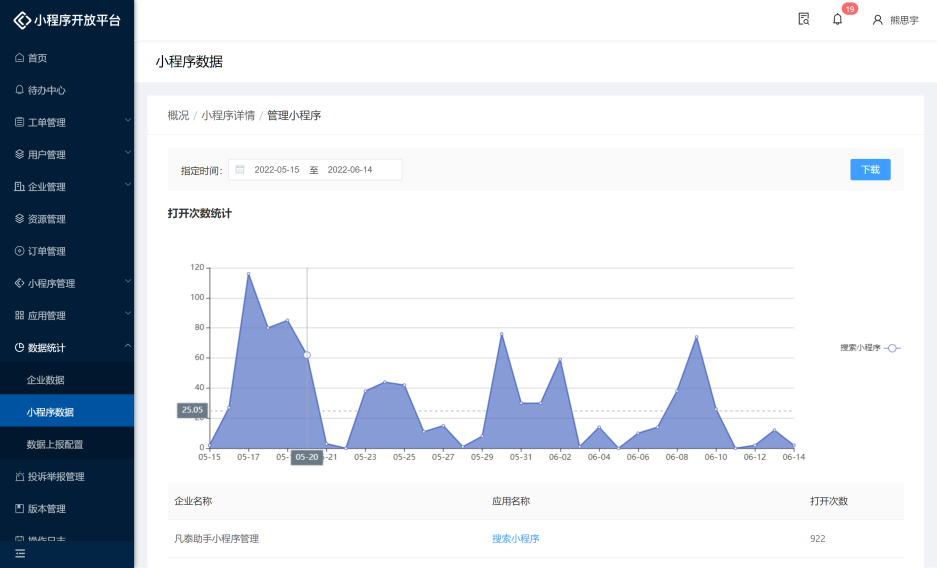
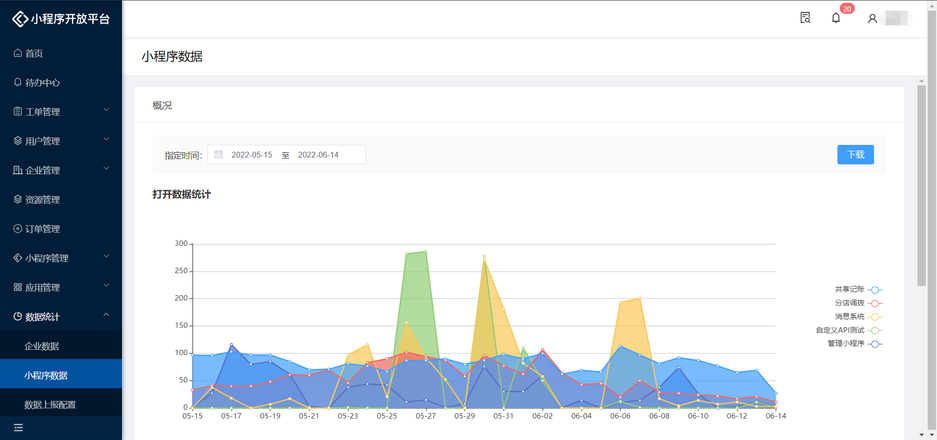
The "Mini-Program Data" homepage displays an overview. You can select a specific time period to view the open counts of Mini-Programs published on the enterprise side. By default, it shows the top 5 Mini-Programs by open count and the top 5 partner channels (Host-Apps), representing the most popular Mini-Programs and the most popular partner applications.
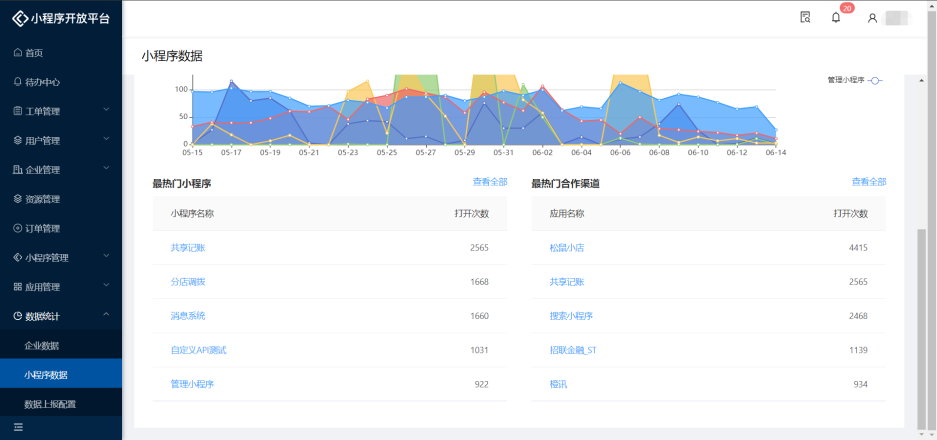
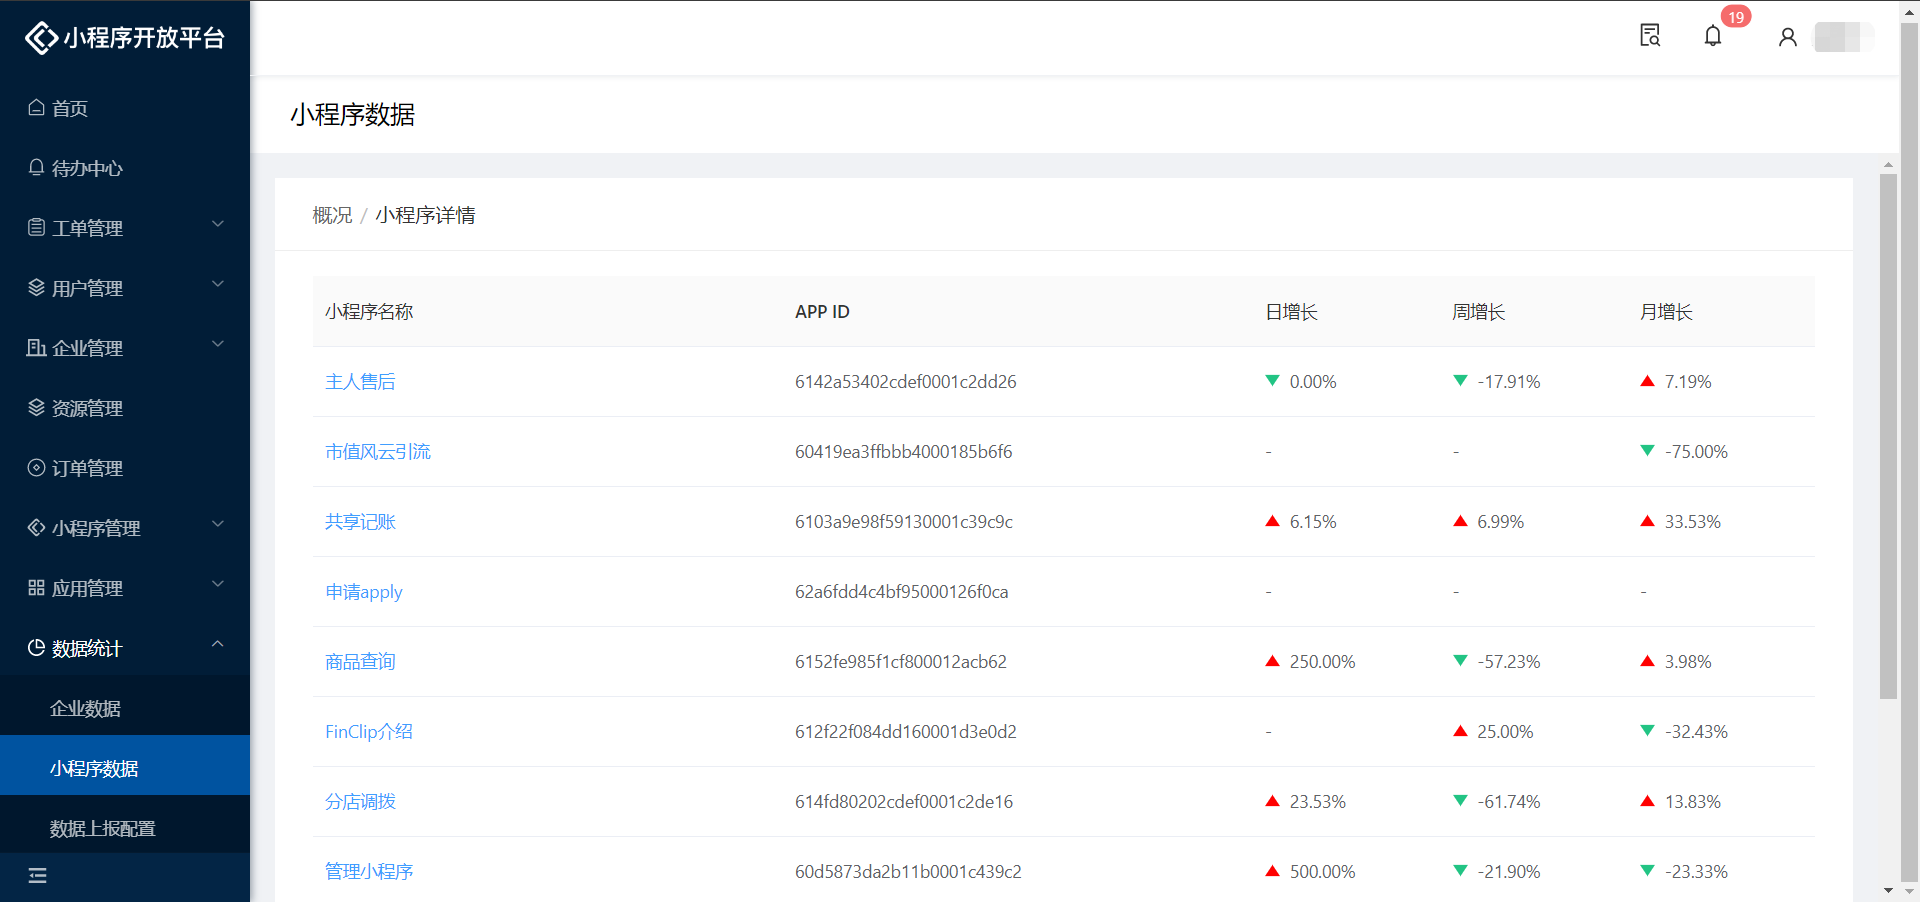
Clicking "View All" in the "Most Popular Mini-Programs" list allows you to see details of open counts for all Mini-Programs, including growth details statistics by day, week, and month.
"Most Popular Partner Channels" displays the top 5 popular partner applications (Host-Apps) by open count within the specified time period, based on the partner application dimension. Clicking "View All" allows you to see the open details and ranking proportions for all applications.
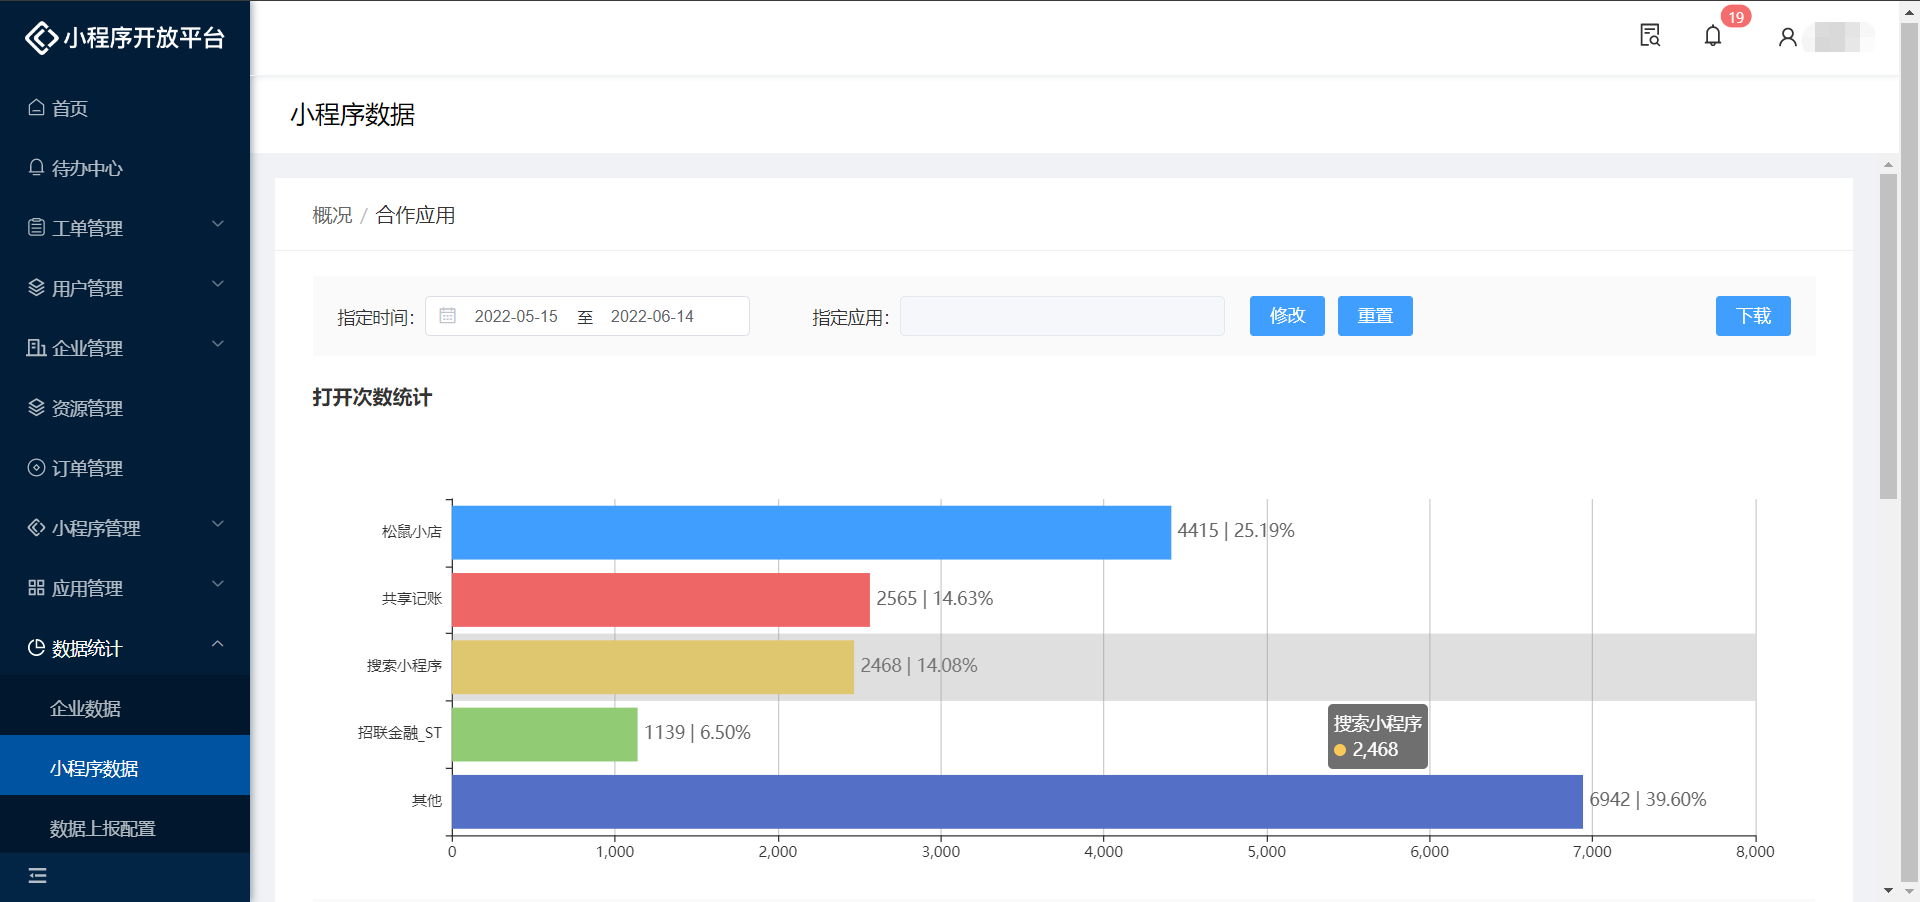
On the statistics page for a specified Mini-Program, you can see the Mini-Program's open trend and data comparisons across different channels within the specified time period.